BISC 101 LAB Exam part 2 (Labs 6-10)
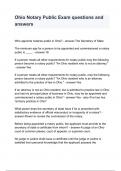
What is a bar graph used for?
Designed to make comparisons of data, often averages.
Useful when you have a categorical independent variable (each bar) and a quantitative
dependent variable (height/length of bar). The bars do not touch.
These are extremely common, and quite useful. They have one drawback which is that they
only show the average value - in other words, they hide all of the raw data points that went
into them.
Side note: Bar and column graphs are both often called bar graphs.
Example: Comparison of the reaction rate for 4 different enzymes
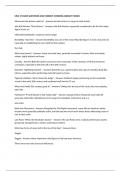
What is a histogram used for?
Histograms appear similar to bar graphs but are interpreted quite differently.
The data represented in a histogram is usually in groups of continuous numerical
(quantitative) data (I.e. 0-5 years, 6-10 years).
In this case, the bars do touch - no space between them. The y-axis of histograms are often
used to show frequency data.
Example: The prevalence of asthma in different age groups.
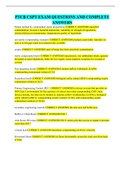
What is a pie graph used for?
Designed to show a percent of a whole, where the whole equals 100%. Pie charts are used
to compare data but cannot be used to see how a
manipulated variable affects a responding variable.
Pie charts do not show change with respect to another variable. Though these are
commonly used in infographics, media, etc, for many types of data, pie charts are not as
appropriate/good" as bar (or column) graphs.
Example: Percent of time that a cell is in each phase of the cell cycle
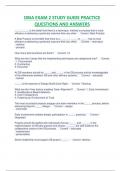
What is a line graph used for?
, A line graph consists of a series of plotted points connected together point to point by a line.
Line graphs depict the effects of a continuous variable and are only used when both
variables are quantitative.
Line graphs show trends, particularly localized or small trends, such as how things change
over time.
Example: Enzymatic activity across a range of temperatures
What is a scatter plot used for?
The points are plotted on the graph, but they are not joined point to point. A best fit line may
be added to a scatter plot to show a trend. Scatter plots are also only used when both
variables are quantitative. These graphs are useful for showing if a correlation exists
between two variables, especially when it is not possible to alter either of the variables (i.e.
in descriptive studies).
Example: Plant height at different altitudes
On a typical graph that has an x and y axis, which axis is used for the dependent variable?
y-axis
What type of graph could be used for this example?
Comparing quadricep muscle length of 5-year-old children who either consume a normal diet
supplemented with B vitamins, or a normal diet with no supplements
Bar graph
What type of graph could be used for this example?
The relative amount of sleep that Canadian teenagers sleep each night.
Scatterplot
What type of graph could be used for this example?
The minimum decibel level heard by young children, teenagers, adults, and retirees
histogram
What is a bar graph used for?
Designed to make comparisons of data, often averages.
Useful when you have a categorical independent variable (each bar) and a quantitative
dependent variable (height/length of bar). The bars do not touch.
These are extremely common, and quite useful. They have one drawback which is that they
only show the average value - in other words, they hide all of the raw data points that went
into them.
Side note: Bar and column graphs are both often called bar graphs.
Example: Comparison of the reaction rate for 4 different enzymes
What is a histogram used for?
Histograms appear similar to bar graphs but are interpreted quite differently.
The data represented in a histogram is usually in groups of continuous numerical
(quantitative) data (I.e. 0-5 years, 6-10 years).
In this case, the bars do touch - no space between them. The y-axis of histograms are often
used to show frequency data.
Example: The prevalence of asthma in different age groups.
What is a pie graph used for?
Designed to show a percent of a whole, where the whole equals 100%. Pie charts are used
to compare data but cannot be used to see how a
manipulated variable affects a responding variable.
Pie charts do not show change with respect to another variable. Though these are
commonly used in infographics, media, etc, for many types of data, pie charts are not as
appropriate/good" as bar (or column) graphs.
Example: Percent of time that a cell is in each phase of the cell cycle
What is a line graph used for?
, A line graph consists of a series of plotted points connected together point to point by a line.
Line graphs depict the effects of a continuous variable and are only used when both
variables are quantitative.
Line graphs show trends, particularly localized or small trends, such as how things change
over time.
Example: Enzymatic activity across a range of temperatures
What is a scatter plot used for?
The points are plotted on the graph, but they are not joined point to point. A best fit line may
be added to a scatter plot to show a trend. Scatter plots are also only used when both
variables are quantitative. These graphs are useful for showing if a correlation exists
between two variables, especially when it is not possible to alter either of the variables (i.e.
in descriptive studies).
Example: Plant height at different altitudes
On a typical graph that has an x and y axis, which axis is used for the dependent variable?
y-axis
What type of graph could be used for this example?
Comparing quadricep muscle length of 5-year-old children who either consume a normal diet
supplemented with B vitamins, or a normal diet with no supplements
Bar graph
What type of graph could be used for this example?
The relative amount of sleep that Canadian teenagers sleep each night.
Scatterplot
What type of graph could be used for this example?
The minimum decibel level heard by young children, teenagers, adults, and retirees
histogram