Finance Tutorial 3
Question 1
How would you go about testing the hypotheses that the Fama French factors (other than the
market factor) represent risk factors? In answering this, bear in mind what the alternative
hypotheses are
The hypothesis is that Fama French factors represent risk factors, with assets being rewarded with risk
premiums depending on their correlation with these risk factors, captured in the assets' factor betas.
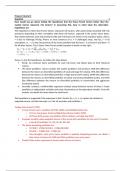
The relation between asset risk premium (LHS) and risk factors are shown in the equation below, with α i
= 0 due to Arbitrage Pricing Theory as most instances of α i ≠ 0 arbitraged away, and E(ε it) = 0 by
assumption. (rkt – rf) is the risk premium of the factor portfolio that has beta = 1 on factor k and beta = 0
for all other factors. The 5-factor Fama French model equation is shown on the right.
Hence, to test the hypotheses, we follow the steps below:
Firstly, we construct factor portfolios for each risk factor and obtain data on their historical
returns.
The factor portfolios’ returns include: the market portfolio’s risk premium, SMB (the difference
between the returns on diversified portfolios of small and large firm stocks), HML (the difference
between the returns on diversified portfolios of high and low B/M stocks), RMW (the difference
between the returns on diversified portfolios of robust and weak profitability stocks), and CMA
(the difference between the returns on diversified portfolios of conservative and aggressive
investment stocks)
Secondly, conduct a multivariable regression analysis using historical returns of these 5 factor
portfolios as independent variables and asset risk premium as the dependent variable. From this
analysis, we obtain the factor betas for each factor.
The hypothesis is supported if the exposures to the 5 factors (b i, si, hi, ri, ci) capture all variation in
expected returns, and the intercept a i is 0 for all securities and portfolios i.
Testing Fama French (1993)
In June of each year t, partition all NYSE, AMEX, and NASDAQ stocks into
o (1) Two size groups: Small and Big (below/above median NYSE)
o (2) Three B/M groups: Low (bottom 30%), Medium, and High (top 30%)
Compute monthly value-weighted returns of the six size-B/M portfolios for the next 12 months.
o 6 size-B/M portfolios: SL, SM, SH, BL, BM, BH
The factor-mimicking portfolios are
o (1) SMB = 1/3(SL+SM+SH) –1/3(BL+BM+BH)
o (2) HML = 1/2(BH+SH) –1/2(BL+SL)
o Own thoughts: each year's factor portfolio is updated. Repeating process, we obtain a
time series of returns for SMB and HML portfolios over many years.
Conduct time-series regression of excess asset returns on factors
, o Own thoughts: then you get factor betas... Then what? Is it like testing CAPM where you
then do a cross-sectional regression with the estimated factor betas, then check if alpha
= 0?
Alternative hypothesis
Risk hypothesis predicts that the value stocks are riskier along one or more of these dimensions
o Measuring risk in practice: with market beta, total volatility, left tail risk VAR (risk of
poor returns only, disregard positive return volatility)
Mispricing hypothesis predicts that these return deviations (based on size, value) are temporary
mispricing that would disappear in the future. Why this is the case is unclear.
Data snooping
Another tutor's answer
What results do we know?
Small and Value stocks generate alpha not captured by the market factor
What are the two possibilities?
FF Factors capture returns to compensate for risk:
o Specific types of firms, say small, have specific risk
FF Factors capture mispricing:
o Small firms have low market cap because they are underpriced
Can we test the risk hypothesis?
Risk of value / small stocks are directly measurable
Possible measures:
o Market beta (exposure to systematic risk)
o Total volatility
o Performance in economic downturns / recessions or crises
o Left tail risk (i.e. higher chance of bankruptcy)
Small / Value stocks should be riskier along one or more of these dimensions, compared to their
counterparts
How could we statistically test for this?
Test for risk hypothesis: Fama-French (1993)
o “For stocks, portfolios constructed to mimic risk factors related to size and B/M equity
ratio capture strong common variation in returns, no matter what else is in the time-
series regressions. This is evidence that size and book-to-market equity indeed proxy for
sensitivity to common risk factors in stock returns.”
Test for mispricing hypothesis:
o Raises the issue of what drives mispricing and why on average does it get corrected
o A possible test is to check whether, post discovery, these factors have ‘corrected’
What do you think are the forces that may lead to under-pricing / mispricing?
o Limits to arbitrage enable mispricing to persist
o Market frictions for these limits have hugely ameliorated: Trading costs are lower,
information availability and computing power to process information have increased
dramatically
o Can rational investors misprice assets or do we need to go to behavioural explanations
The benefits of buying summaries with Stuvia:
Guaranteed quality through customer reviews
Stuvia customers have reviewed more than 700,000 summaries. This how you know that you are buying the best documents.
Quick and easy check-out
You can quickly pay through credit card or Stuvia-credit for the summaries. There is no membership needed.
Focus on what matters
Your fellow students write the study notes themselves, which is why the documents are always reliable and up-to-date. This ensures you quickly get to the core!
Frequently asked questions
What do I get when I buy this document?
You get a PDF, available immediately after your purchase. The purchased document is accessible anytime, anywhere and indefinitely through your profile.
Satisfaction guarantee: how does it work?
Our satisfaction guarantee ensures that you always find a study document that suits you well. You fill out a form, and our customer service team takes care of the rest.
Who am I buying these notes from?
Stuvia is a marketplace, so you are not buying this document from us, but from seller ib45pointer. Stuvia facilitates payment to the seller.
Will I be stuck with a subscription?
No, you only buy these notes for $5.49. You're not tied to anything after your purchase.