Transactions of the American Fisheries Society 129:315–332, 2000
q Copyright by the American Fisheries Society 2000
Development and Test of a Whole-Lifetime Foraging and
Bioenergetics Growth Model for Drift-Feeding Brown Trout
JOHN W. HAYES,* JOHN D. STARK, AND KAREN A. SHEARER
Cawthron Institute, Private Bag 2, Nelson, New Zealand
Abstract.—We developed and tested a combined foraging and bioenergetics model for predicting
growth over the lifetime of drift-feeding brown trout. The foraging component estimates gross
energy intake within a fish- and prey size-dependent semicircular foraging area that is perpendicular
to the flow, with options for fish feeding across velocity differentials. The bioenergetics component
predicts how energy is allocated to growth, reproduction, foraging costs, and basal metabolism.
The model can reveal the degree to which growth is limited by the density and size structure of
invertebrate drift within the physiological constraints set by water temperature. We tested the
model by predicting growth based on water temperature and on drift density and size structure
data from postemergence to age 12, and we compared the predictions with observed size at age
as determined from otoliths and scales for a New Zealand river brown trout population. The model
produced realistically shaped growth curves in relation to the observed data, accurately predicting
mean size at age over the lifetime of the trout, assuming 24-h maximum rations and including
diurnal drift-foraging costs (predicted versus observed weight r 2 5 0.94; length r 2 5 0.97). The
model predicted that, within a given water-temperature regime, growth is limited primarily by
reproduction costs but also by increasing foraging costs as trout grow (a phenomenon that is
associated with the increasing foraging time that is required in order to feed to satiation on small
invertebrate drift prey). Invertebrate drift size structure significantly influenced predicted growth,
especially maximum size, through its effect on foraging time. The model has potential in terms
of the exploration of growth-limiting factors and has associated use as an environmental-impact
tool and as an aid for hypothesis generation in studies of salmonid growth processes.
Foraging and bioenergetics models are among 1993; Ludlow and Hardy 1996; Braaten et al.
the most recent tools available for use in evalu- 1997), to predict salmonid distribution at the pool
ating complex biological and biophysical relation- and river level (Hughes 1992a, 1992b, 1998), and
ships in aquatic ecosystems. These models make to assess salmonid growth and stocking rates in
a significant contribution to the suite of tools that lakes (Kerr 1971; Stewart et al. 1981). Ultimately,
can be applied to population and growth limiting- energetics-based models have the potential to pre-
factor analysis. For river fisheries, these models dict lotic fish carrying capacity as a function of
offer a way to move beyond some of the limitations geomorphic, flow, water quality, and food vari-
of traditional habitat methods of assessing flow ables.
needs [e.g., the Instream Flow Incremental Meth- Foraging models are simplifications of the man-
odology (Bovee 1982; Mathur et al. 1985; Orth ner in which fish find and consume their food;
1987)] and of correlative models that relate fish these models take into consideration factors such
response to environmental and biotic variables as foraging behavior and swimming speed, prey
(e.g., Binns and Eiserman 1979; Jowett 1992; density and size, and prey capture distance and
Nehring and Anderson 1993). Foraging and bio- efficiency (and their dependence on water clarity)
energetics models are based on functional re- (Ware 1972; Vinyard and O’Brien 1976; Fausch
sponses of fish to physical and prey variables, 1984; Hughes and Dill 1990; Breck 1993). Bio-
meaning that they can be used to investigate the energetics models comprise a suite of metabolic
ultimate causal mechanisms controlling growth equations that quantify functional relationships be-
and habitat selection. Such models have been used tween water temperature (and other physical vari-
to improve realism in the assessment of salmonid ables) and digestion and metabolic, kinetic, and
habitat requirements (Smith and Li 1983; Addley growth processes in fish based on energy as a com-
mon unit (Elliott 1976b; Hewett and Johnson 1992;
Hayes 1996). Together, foraging and energetics
* Corresponding author: johnh@cawthron.org.nz models can be used to determine how fish make a
Received July 20, 1998; accepted May 18, 1999 living within a given environment.
315
,316 HAYES ET AL.
Brown trout Salmo trutta have flexible feeding should be energetically disadvantaged and their
behaviors, but foraging on invertebrate drift pre- growth truncated.
dominates in moderate- to swiftly flowing rivers We are not aware of any published study that
(Bachman 1984; Hayes and Jowett 1994). Inver- has attempted to field test a combined foraging and
tebrate drift density is a more direct measure of bioenergetics model for the growth of a drift-
the food that is available to trout than is benthic feeding salmonid. One study has compared ob-
invertebrate density, or biomass, and it is easier served with predicted growth of brown trout based
to incorporate invertebrate drift density into a for- on a bioenergetics model, but foraging costs were
aging model. Drift-feeding trout maximize net en- not accounted for—and neither were reproduction
ergy intake while minimizing energy expenditure costs—so the comparison was confined to imma-
by feeding from sheltered positions into faster wa- ture fish (Preall and Ringler 1989).
ter, where drift rates are higher (Fausch 1984), and The objectives of this study were (1) to develop
by selecting large prey from the drift (Ware 1972; and test a combined foraging and bioenergetics
Ringler 1979; Wankowski 1981; Bannon and Rin- model of growth over the lifetime of drift-feeding
gler 1986). Applications of salmonid bioenergetics brown trout at the river section scale, (2) to de-
models in rivers have focused mainly on assessing termine the influence of reproduction and foraging
the relative energetic profitability of drift-feeding costs on the shape of the growth curve and max-
sites from estimates of net energy intake (Fausch imum size within a given river temperature regime,
1984; Hughes and Dill 1990; Hughes 1992a, and (3) to determine the influence of invertebrate
1992b). A logical extension is the accurate esti- drift size structure (as it interacts with foraging
mation of net energy intake and physiological pro- costs) on growth.
cesses to predict growth, estimations that will set
Model Development
the foundation for energetics-based carrying ca-
pacity and population dynamics models (cf. Clark Conceptual Framework
and Rose 1997). However, a foundational element
Our model is composed of a foraging submodel,
in this development is verification that foraging
a bioenergetics submodel (comprising a suite of
and bioenergetics models can predict actual
energetics equations), and an annual growth sub-
growth, not simply relative growth and feeding
model. The foraging model uses invertebrate drift
profitability (Addley 1993).
density and size composition (3-mm size-classes)
Bachman (1982) proposed a conceptual growth and water temperature for a series of user-defined
model for drift-feeding salmonids, one that pro- time periods (weeks to months) to calculate rate
vides a fruitful framework upon which to build a of food intake and apportion time spent foraging
quantitative energetics-based growth model. His (versus time spent maintaining a position at the
conceptual model was based on optimal foraging focal point or time spent resting). The output from
theory and predicted that growth and size should the foraging model and water temperature data are
be limited by the finite energy availability set by used by the energetics model to calculate daily
the mean drift density for any river. The metabolic energy intake, to balance the energy budget, and
rate of salmonids increases exponentially with to calculate growth over each time period. The
size, water velocity, and temperature (Elliott annual growth model then integrates growth over
1976b; Brett and Glass 1973), whereas the mean the time periods for each year, accounting for re-
supply of drift increases only linearly with water production costs after maturity.
velocity (Elliott 1967; Fausch 1984). Consequent-
ly, growth rate must decline with age, and for a Geometry of the Foraging Model
given river, the energy available from drift will The foraging area of a drift-feeding trout can be
limit the maximum fish size, unless the trout mi- approximated by delineating a semicircle around
grate to more food-rich habitats or are able to the trout, which is positioned close to the bottom
switch to alternative prey with greater energy re- of the river at its focal point, which is associated
turn. Faced with the increasing energy costs of with a velocity refuge—such as a rock (Figure 1).
metabolism and swimming as size increases, and The semicircle should be visualized as a two-
faced as well with reproductive energy costs, trout dimensional cross section that is perpendicular to
must eat larger and larger prey as they age in order the current, looking upstream. The radius of the
to maintain growth. If large invertebrates are not semicircle, the foraging radius, is represented by
well represented in the drift, then large trout FR. As drifting invertebrates are carried into this
, BROWN TROUT BIOENERGETICS 317
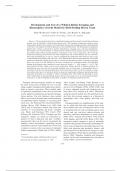
Figure 1.—Cross section of the foraging area (looking upstream), showing how the foraging space is divided to
characterize velocities above and adjacent to the trout’s focal point. CA1–3 5 capture areas; AT and AS are subareas
used in calculating CA2 (Table 1); mVel1–3 5 mean column velocities; FpVel 5 focal point velocity; and FR 5
foraging radius.
semicircle by the current, the trout rises upward based on two-thirds of the FR (Table 1). For the
and/or sideways to intercept the prey and then re- vertical velocity differential option, the focal point
turns to its focal point. Lateral and vertical velocity velocity is calculated by applying a velocity dif-
differentials (velocity shears) are optional in the ferential to the predicted mean column velocity
model. In order to accommodate for the fact that over a distance of twice the fork length of the fish
trout feed across a lateral velocity differential, the (Table 1).
semicircle is divided into three strips, with the prey Foraging radius was calculated as a continuous
capture areas in each strip represented by CA1–3. function of fork length using the conceptual model
The subcapture area CA2 is calculated by summing of the geometry of prey interception, which was
the sub-areas (AT and AS), which are formed when developed by Hughes and Dill (1990) for Arctic
the radius (FR) bisects either side of CA2 into a grayling Thymallus arcticus (Table 1). This com-
triangle and a sector of a semicircle (Table 1). The putation was compatible with modeling growth, in
subcapture areas CA1 and CA3 can be obtained by which case predicted size at the end of a given
halving the remaining foraging area. The mean time period becomes the input for calculating con-
column water velocities (at 0.4 times depth) of each sumption and growth in the next time period. Note
of the capture areas are represented by mVel1–3, that the FR increases with both increasing prey
and the focal point velocity [at 0.1 times twice the size and fish size (because of the greater eye di-
trout’s fork length above the substrate (Hayes and ameter and the retinal acuity of larger fish) and
Jowett 1994)] is represented by FpVel. with decreasing water velocity.
We estimated mean velocity of the water column Rate of food intake.—The above foraging model
at the trout’s position (mVel2) using an equation was used to calculate rate of food intake, or con-
for the optimal swimming speed of a general sal- sumption (Cw), integrated over n 3-mm prey size-
monid (from Stewart 1980; Table 1). Predictions classes in the three prey subcapture areas (CA1–3)
of this equation matched very well with mean col- using a modification of Hughes and Dill’s (1990)
umn velocities for adult brown trout in New Zea- equation 2 (Table 1). Consumption was calculated
land rivers (Hayes and Jowett 1994) when tem- for the subset of prey falling within predicted max-
perature was fixed at 138C, the optimum temper- imum and minimum prey sizes, which are limited
ature for growth of brown trout on maximum ra- by mouth gape, foraging cost–benefit relation-
tions (Elliott 1994). ships, and gill raker spacing (Wankowski 1979;
For the lateral velocity differential option, one Bannon and Ringler 1986) (Table 1).
of the adjacent mean column velocities assumes Apportioning foraging time.—Foraging costs,
the same value as the mean column velocity at the calculated later in the energetics model, were split
trout’s position (in CA2) (i.e., mVel2), and the other between total prey-interception time and time
adjacent velocity (mVel1) is calculated by applying spent maintaining station at the focal point. The
a velocity differential to mVel2 over a distance proportion of time spent intercepting prey items