Statistics Success Stories and Cautionary Tales
CHAPTERl
EXERCISE SOLUTIONS
1.1 a. The fastest speed was 150 miles per hour.
b. The slowest speed driven by a male was 55 miles per hour.
c. 1/4 of the females reported having driven at 95 miles per hour or faster. Notice that
95 mph is the upper quartile for females. By definition, about 1/4 of the values in a dataset are greater
than the upper quartile.
d. 1/2 of the females reported having driven 89 mph or faster. Notice that 89 mph is the median value.
e. 1/2 of 102 = 51 females have driven 89 mph or faster.
Note: For parts (d) and (e) the answer would have to be adjusted if there were any females who reported 89
as their value, but from the data on page 4 we can see that there were not. Because there were no "ties" with
the median, we know that exactly half of the values fall above it and the other half fall below it.
1.2 a. The median height is 65 inches.
b. Range = tallest - shortest = 71 - 59 = 12 inches.
c. The interval from 59 to 63.5 inches contains the shortest 1/4 of these students. This interval is from the
1ninimum to the lower quartile.
d. The interval from 63.5 to 67.5 inches contains the middle 1/2 of these students. This is an interval from
the lower quartile to the upper quartile.
1.3 a. The observed rate of cervical cancer in Vietnamese American women is 86 per 200,000. This could also
be expressed as 43 per 100,000 or 4.3 per 10,000, and so on. In decimal form, it is .00043.
b. The risk of developing cervical cancer for Vietnamese American women in the next year is 86/200,000
= .00043.
c. The rate of 86 per 200,000 is based on past data and tells us the number of Vietnamese American
women who developed cervical cancer out of a population of 200,000. The risk utilizes the rate from the
past to tell us the future likelihood of cervical cancer in other Vietnamese American women.
1.4 a. The base rate is about 13 in 1000, or about .013.
b. The risk for men who smoke is just over 13 times the rate for non-smokers, or about .169.
1.5 a. All teens in the United States at the time the poll was taken.
b. All teens in the United States who had dated at the time the poll was taken.
1.6 A population is a collection of all individuals of interest while a sample is a subset of the population of
interest, for which measurements are taken in a study. In Case Study 1.6, the population of interest is
probably all men, and possibly women as well. However, the sample consisted of 22,071 male physicians
who volunteered for the study, so the population to which the results apply is all men similar to them.
1.7 a. All adults in the United States at the time the poll was taken.
b. � =.03lor 3.1%.
vl048
c. 34%±3.1%, or 30.9% to 37.1%.
1.8 a. The population is probably all Canadians who were eligible to participate in the survey (which is
probably all adults with telephones).
b. There were 2000 people in the sample.
1 1
c. ,- = r::-::-;:;: =.022 or 2.2%.
"n "2000
d. In the sample, 16% viewed ilmnigration as having a negative impact. The interval 16%±2.2%, or
13.8% to 18.2%, is 95% certain to cover the true percent of Canadians who viewed immigration as
having a negative impact (at the time of the poll).
, 1 1
Solve for n in the equation ,--- = .05 = -. Answer is n = 400 teenagers.
vn 20
1
Solve for n in the equation J; = .10. Answer is n = 100.
a. This is an example of a self-selected or volunteer sample. Magazine readers voluntarily responded to the
survey and were not randomly selected.
b. These results may not represent the opinions of all readers of the magazine. The people who respond
probably do so because they feel stronger about the issues (for example, violence on television or
physical discipline) than the readers who do not respond. So, they may be likely to have a generally
different point of view than those who do not respond.
1.12 The exercise did not specify what the survey is about, but no matter what, the survey is based on a
self-selected sample, and people who feel strongly about the issues and/or who have extra time are more
likely to respond. The results will not be representative of all students who use the cafeteria.
1.13 a. Randomized experiment (because students were randomly assigned to the two methods).
b. Observational study (because people cannot be randomly assigned to smoke or not).
c. Observational study (because people cannot be randomly assigned to be a CEO or not).
a. Randomized experiment, because students were randomly assigned to receive Vitamin C or placebo.
b. Observational study, because the patients were not randomly assigned to do anything. (Note that a
random sample is not the same thing as random assigmnent.)
c. Randomized experiment, because participants were randomly assigned to meditation or low-fat diet.
1.15 Answers will vary, but one possibility is general level of activity. It is likely to differ for elderly people
who attend church regularly and those who don't, and it is also likely to affect blood pressure. So it might
partially explain the results of this study.
1.16 a. Number of courses might be a confounding variable. Students taking many courses may sleep less due
to the amount of work involved and may not do as well in school due to the load.
b. Weight is not likely to be a confounding variable. Weight is probably not related either to amount of
sleep or to grades.
c. Hours spent partying might be a confounding variable. Students who party a lot may sleep less, and may
also get lower grades because they're not studying.
1.17 You would need to know how large the difference in weight loss was for the two groups. If the difference
in weight loss is very small (but not 0), it could be statistically significant, but not have much practical
importance.
1.18 Statistical significance is when there is a relationship or difference that is large enough to be unlikely to
have occurred in the sample if there was no relationship or difference in the population of interest. Practical
significance occurs when the relationship or difference is large enough to be important or meaningful in a
"real world" sense. A result can be statistically significant, but not practically significant. This is especially
likely to occur in studies with very large sample sizes.
1.19 You would want to know how many different relationships were examined. If this result was the only one
that was statistically significant out of many examined, it could easily be a false positive.
1.20 A false positive occurs when a relationship or difference is said to be statistically significant based on
examining information from a sample, but in fact there is no relationship or difference in the population.
1.21 The placebo group estimates the baseline rate of heart attacks for men not taking aspirin. So, the estimated
baseline rate of heart attacks is 189/11,034, which is about 17 heart attacks per 1000 men or 17/1000. (See
Table 1.1 for the data.)
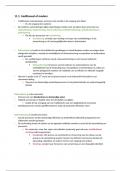
1.22 a. The amount of exercise per week is similar for men and women except that there are a few high values
for the men. The dotplot follows.
, Figure for Exercise 1.22a
Gender
••• • • • • • •• • • •
m
• ••• •
• •• •• • • •• •
0 100 200 300 400 500 600
Exercise per week (minutes)
b. Women, median = 190 min. Men, median = 180 min.
To find the median,put the data in order first.
For women, the ordered list of data is:
0,0,0,60,60,70,100,180,200,240,240,270,300,360,360,450
The number of women is even (16),so the median is the average of the middle two values in the ordered
list. These middle two values,underlined and bold in the above list,are 180 and 200 and their average is
190.
For men, the ordered list of data is:
0,0,14,60,90,120,180,240,300,300,360,480,600
The number of men is odd (13),so the median is the middle value in the ordered data. This value,
underlined and bold in the list above,is 180.
c. Although the median response is different for women and men,the difference is only 10 minutes. The
weekly amount of exercise is about the same for the samples of women and men.
1.23 a.
Minutes of Exercise ))er Week
Median 180
Quartiles 37 330
Extremes 0 600
To determine the summary,first write the responses in order from smallest to largest.
The ordered list of data is:
0,0,14,60,90,120,180,240,300,300,360,480,600
Minimum = 0 min.
Maximum = 600 min.
Median = 180 min. (middle value in the ordered list)
Lower quartile = 42 min. It is the median of the values smaller than the median.
These are 0,0,14,60,90,120.
Median of these six values is (14 + 70)/2 = 42.
Upper quartile = 330 min. It is the median of the values larger than the median.
Values larger than the median are 240,300,300,360,480,600.
Median of these values is (300 + 360)/2 = 330.
b. Reported exercise hours per week for the men in the sample ranged from a low of O to a high of 600
minutes per week. The median response was 180 minutes (3 hours). About 1/2 of the men (the middle
, Chapter 1 Solutions, 6th ed. Page 4 of 6
half) reported exercising between 37 and 330 minutes (5 and a half hours) per week. About 1/4 said they
exercised less than 37 minutes per week while 1/4 said they exercised more than 330 minutes per week.
1.24 a.
Minutes of Exercise per Week
Median 190
Quartiles 60 285
Extremes 0 450
To determine the summary, first write the responses in order from smallest to largest.
The ordered list of data is:
0, 0, 0, 60, 60, 70, 100, 180, 200, 240, 240, 270, 300, 360, 360, 450
Minimum = 0 min.
Maximum = 450 min.
Median = 190 min. (average of the middle two values in the ordered list, which are 180 and 200)
Lower quartile = 60 min. It is the median of the values that are smaller than the median.
These are 0, 0, 0, 60, 60, 70, 100, 180.
Median of these eight values is (60 + 60)/2 = 60.
Upper quartile = 285 min. It is the median of the values that are larger than the median.
Values larger than the median are 200, 240, 240, 270, 300, 360, 360, 450.
Median of these values is (270 + 300)/2 = 285.
b. Reported exercise hours for the women in the sample ranged from a low of 0 to a high of 450 minutes
per week. The median response was 190 minutes (3 hours and 10 minutes). About 1/2 of the women (the
middle half) reported exercising between 60 and 285 minutes per week. About 1/4 said they exercised
less than 60 minutes per week while 1/4 said they exercised more than 285 minutes per week.
1.25 a. This is an observational study because vegetarians and non-vegetarians are compared and these groups
occur naturally. People were not assigned to treatment groups.
b. Since this is an observational study and not a randomized experiment, we cannot conclude that a
vegetarian diet causes lower death rates from heart attacks and cancer. Other variables not accounted for
may be causing this reduction.
c. This answer will differ for each student. One potential confounding variable is amount of exercise. This
is a confounding variable because it may be that vegetarians also exercise more on average and this led
to lower death rates from heart attacks and cancer.
1.26 Base rates were not given. In this study, a base rate would be the actual rate (risk) of a particular cause of
death for people who are not vegetarians.
1.27 The base rate or baseline risk is missing from the report. You need to know the base rate of cancer of the
rectum for men to decide if the increased risk from drinking beer is large or small.
1.28 a. This was a randomized experiment because volunteers were randomly assigned to wear either a nicotine
patch or a placebo patch.
b. You can conclude that use of nicotine patches leads to a higher success rate for those trying to quit
smoking than use of placebo patches.
c. It was advisable to assign some of the patients to wear a placebo patch because then you can compare
the success rate of those patients to the success rate of the patients wearing nicotine patches. You will
also learn in a future chapter that even though they have no active ingredients, placebos can have a large
psychological effect. Also, presumably people in the experiment want to quit smoking, so some will
succeed regardless of treatment method.