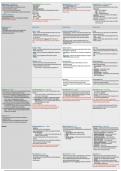
Name: Score:
69 Multiple choice questions
Definition 1 of 69
It is a symmetric distribution that has a constant probability for all values between a minimum
and a maximum.
counting rules
Discrete random variable
Uniform Probability distribution
Distribution shape
Definition 2 of 69
measures the relative location of values in the dataset. This helps determine how far a
particular value is from the mean. Uses mean and standard deviation in its calculation
Distribution shape
Z-Score
Variance
Percentile
Definition 3 of 69
is the average value for a variable. =AVERAGE()
Observation
joint probability
Mean (average)
Population
,Definition 4 of 69
is the event containing all sample points belonging to event A, event B, or both. Denoted by:
AÈB
Union of two events
Random Variable
conditional probability
Multiplication law
Definition 5 of 69
the value that occurs with the greatest frequency. =MODE()
Marginal Probability
Mode
Range
Dataset
Definition 6 of 69
relates to the case for estimating the number of occurrences over a specified interval of
space/time. =POISSON.DIST()
Bivariate probability distribution
Distribution shape
Marginal Probability
Possion Probability Distribution
,Definition 7 of 69
measures variability using all the data since it is based on the difference between the value of
Xi and the mean. A difference is called a deviation from the mean. =VAR.S( )
Variance
Distribution shape
covariance
Outliers
Definition 8 of 69
1. Q3-Q1, is the range of the middle 50% of the data. =QUARTILE.INC(values, 3) -
QUARTILE.INC(values, 1)
Distribution shape
prescriptive analyics
predictive analytics
Interquartile range
Definition 9 of 69
multistep experiments (such as tossing a coin twice) have the following outcome S= {(H, H); (H,
T); (T, T)}.
counting rules
Bar & Pie chart
crosstabulation
Random Variable
, Definition 10 of 69
a counting rule allowing one to count the number of experimental outcomes when selecting #
objects from a set of # objects
crosstabulation
counting rules
permutations
combinations
Definition 11 of 69
measures the variability or dispersion of the random variable. Standard deviation squared.
=VAR.S()
Variance
Standard deviation
Z-Score
Percentile
Definition 12 of 69
a measure that is used to quantify the amount of variation or dispersion of a set of data values.
=STDE.P( )
statistical inference
Interquartile range
Random Variable
Standard deviation