100% satisfaction guarantee Immediately available after payment Both online and in PDF No strings attached
logo-home
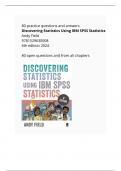
Discovering Statistics Using IBM SPSS Statistics / 80 test questions and answers entire book / Andy Field / 6th edition 2024 $7.97   Add to cart

Exam (elaborations)

Discovering Statistics Using IBM SPSS Statistics / 80 test questions and answers entire book / Andy Field / 6th edition 2024

 1 view  0 purchase

These are 80 test questions and answers from the entire book Discovering Statistics Using IBM SPSS Statistics by Field the 6th edition 2024. The questions go from general to more complex. Used by our study group in preparation for the exam.

Preview 2 out of 13  pages

  • November 7, 2024
  • 13
  • 2024/2025
  • Exam (elaborations)
  • Questions & answers
book image

Book Title:

Author(s):

  • Edition:
  • ISBN:
  • Edition:
All documents for this subject (18)
avatar-seller
Scriptiebibliotheek
, 80 test questions and answers based on the book *Discovering Statistics
Using IBM SPSS Statistics* (6th edition) by Andy Field.

We’ve made these questions as a study group in preparation for the final
exams.


1. What is the primary goal of descriptive statistics?

- Answer: Descriptive statistics summarize and describe the features of
a dataset in a meaningful way, such as through measures of central
tendency, dispersion, and graphical representations.


2. What is a frequency distribution?

- Answer: A frequency distribution is a summary of how often each
different value occurs in a dataset.


3. What is the purpose of a histogram?

- Answer: A histogram is a graphical representation of the distribution of
a dataset. It shows the frequency of data points within certain ranges
(bins).


4. What does the term “central tendency” refer to?

- Answer: Central tendency refers to the central point or typical value in
a dataset, commonly measured using the mean, median, or mode.


5. What is the difference between the mean, median, and mode?

- Answer: The mean is the average of all data points, the median is the
middle value when data is ordered, and the mode is the value that occurs
most frequently.


6. How do you calculate the standard deviation?

- Answer: The standard deviation is calculated as the square root of the
variance, which measures the average squared deviation from the mean.


7. What is a z-score?

The benefits of buying summaries with Stuvia:

Guaranteed quality through customer reviews

Guaranteed quality through customer reviews

Stuvia customers have reviewed more than 700,000 summaries. This how you know that you are buying the best documents.

Quick and easy check-out

Quick and easy check-out

You can quickly pay through credit card or Stuvia-credit for the summaries. There is no membership needed.

Focus on what matters

Focus on what matters

Your fellow students write the study notes themselves, which is why the documents are always reliable and up-to-date. This ensures you quickly get to the core!

Frequently asked questions

What do I get when I buy this document?

You get a PDF, available immediately after your purchase. The purchased document is accessible anytime, anywhere and indefinitely through your profile.

Satisfaction guarantee: how does it work?

Our satisfaction guarantee ensures that you always find a study document that suits you well. You fill out a form, and our customer service team takes care of the rest.

Who am I buying these notes from?

Stuvia is a marketplace, so you are not buying this document from us, but from seller Scriptiebibliotheek. Stuvia facilitates payment to the seller.

Will I be stuck with a subscription?

No, you only buy these notes for $7.97. You're not tied to anything after your purchase.

Can Stuvia be trusted?

4.6 stars on Google & Trustpilot (+1000 reviews)

82871 documents were sold in the last 30 days

Founded in 2010, the go-to place to buy study notes for 14 years now

Start selling
$7.97
  • (0)
  Add to cart