100% satisfaction guarantee Immediately available after payment Both online and in PDF No strings attached
logo-home
Statistics & Methodology Last-Minute Study Guide + Exam questions $6.14
Add to cart

Exam (elaborations)

Statistics & Methodology Last-Minute Study Guide + Exam questions

 1 purchase
  • Course
  • Institution

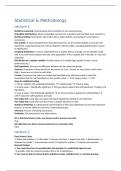
Quick revision notes for last-minute study, which include 2-3 key questions for each lecture and 20 questions that were asked in the exam. Answers are included.

Preview 2 out of 15  pages

  • January 17, 2025
  • 15
  • 2024/2025
  • Exam (elaborations)
  • Questions & answers
avatar-seller
Statistical & Methodology
Lecture 1
Statistical reasoning: Understanding the uncertainty of our measurements.
Probability distributions: Shows all possible outcomes of a situation and how likely each outcome is.
Statistical testing: Summarizes information into a single statistic, accounting for uncertainty in
conclusions.
Test statistic: A value calculated from data that shows how far the sample statistic is from the null
hypothesis, requiring comparison with an objective reference (like a sampling distribution) to assess
its significance.
Sampling distribution: A way to understand how a statistic (like an average, or test statistic) would
vary if you took many samples from the same population. If the t-statistic lies in the tails, it’s rare and
surprising.
Distribution of a random variable: Possible values of a variable (age, gender, income, movie
preferences etc.)
Null hypothesis: Assumes no difference between the two observed groups.
Variance: A measure of how spread out the scores are. Low = Scores are very close to each other.
High = Scores are not close to each other.
P-value: A measure that helps you understand how likely your observed result is under the
assumption that the null hypothesis is true. Small p-value = < 0.05. Large p-value = > 0.05.
Steps for statistical testing:
1. Check t-statistic with sampling distribution  T-statistic large?  Check p-value.
2. Small p-value = Statistically significant  Strong evidence against the null hypothesis  Reject null
hypothesis.
3. Large p-value = Not statistically significant  No strong evidence against the null hypothesis 
CAN’T reject the null hypothesis (nil-null).
One-tailed test: Used when you have directional hypotheses (testing in one direction).
Two-tailed test: Used when you don’t have a specific direction in mind.
Statistical Modeling: A mathematical representation of their data distribution to learn the important
features. It has the ability to control for confounding factors.
Inference: Process of drawing conclusions.
Prediction: The outcome for new observations.

Q1 In the Data Science Cycle, you always need to process your data
True
Q2 Collecting own data is always preferred over secondary data
False

Lecture 2
Data Science Cycle:
1. Define the problem. 2. Collect data. 3. Prepare the data. 4. Explore the data. 5. Build models. 6.
Evaluate the model. 7. Communicate results. 8. Deploy the solution. 9. Monitor and maintain.
Research Design:
1. You must know how to operationalize the question in a statistically rigorous way.
- If possible, code the research question into a set of hypotheses.
2. You must be able to choose/build a statistical model, statistical test, or machine learning

, algorithm that can answer your well-operationalized research question.
- Problem should be supervised (you know both the inputs (features) and outputs (target values).
3. You must understand what types of data/data sources you’ll need.
- Are there prevalent proxies? (Other info you know that could fill in the empty answers that people
don’t want to answer, like their income).
- Prefer secondary data than collecting new data.
EDA: An interactive approach to analyzing and exploring data, allowing researchers to uncover
patterns, trends, and relationships without rigid hypothesis testing (data may appear similar in code
(e.g. same intercept/slope) but show differences when graphed).
CDA: To test specific hypothesis or predictions about data to validate theories OR confirm findings
from EDA.
Rules for EDA vs. CDA
1. When the data are well-understood  CDA. We don’t care about testing hypotheses?  EDA.
2. EDA can be used to generate hypotheses for CDA.
3. EDA can be used to sanity check hypotheses. (If the graph shows a linear relationship  Test
significance in CDA. If no linear relation is visible  Treat the hypothesis as rejected without
modification).

Q1 Listwise deletion will always bias the parameter estimates
False

Q2 Sort the following univariate outlier detection methods based on their breakdown points,
starting from the method with the lowest breakdown point:
(1) boxplot method
(2) externally studentized residual method
(3) internally studentized residual method
(4) median absolute deviation method
(3), (2), (1), (4)

Lecture 3
Cleaning the data:
1. The data is in an analyzable format. 2. All data contains legal values. 3. Any outliers are located and
treated. 4. Any missing data are located and treated.
Missing data: Empty cells where should be observed values. Not every empty cell is a missing data
(company stops operating or survey asking about job satisfaction to someone who is unemployed).
Missing data (response) patterns:
1. Univariate
Only missing values in one column and all the other columns are complete.
2. Monotone
Missing data starts at a certain point in the row and continues to the end. It increases as you go from
left to the right. Looks like a staircase pattern.
3. Arbitrary
Missing data is scattered randomly without any clear pattern.
Nonresponse Rates:
A measure to show how much information is missing.
1. Percent/Proportion missing.
The proportion of cells containing missing data (e.g. 10 missing responses out of 100 = 10%).
2. Attrition Rate

The benefits of buying summaries with Stuvia:

Guaranteed quality through customer reviews

Guaranteed quality through customer reviews

Stuvia customers have reviewed more than 700,000 summaries. This how you know that you are buying the best documents.

Quick and easy check-out

Quick and easy check-out

You can quickly pay through credit card or Stuvia-credit for the summaries. There is no membership needed.

Focus on what matters

Focus on what matters

Your fellow students write the study notes themselves, which is why the documents are always reliable and up-to-date. This ensures you quickly get to the core!

Frequently asked questions

What do I get when I buy this document?

You get a PDF, available immediately after your purchase. The purchased document is accessible anytime, anywhere and indefinitely through your profile.

Satisfaction guarantee: how does it work?

Our satisfaction guarantee ensures that you always find a study document that suits you well. You fill out a form, and our customer service team takes care of the rest.

Who am I buying these notes from?

Stuvia is a marketplace, so you are not buying this document from us, but from seller iuk. Stuvia facilitates payment to the seller.

Will I be stuck with a subscription?

No, you only buy these notes for $6.14. You're not tied to anything after your purchase.

Can Stuvia be trusted?

4.6 stars on Google & Trustpilot (+1000 reviews)

70113 documents were sold in the last 30 days

Founded in 2010, the go-to place to buy study notes for 15 years now

Start selling

Recently viewed by you


$6.14  1x  sold
  • (0)
Add to cart
Added