100% satisfaction guarantee Immediately available after payment Both online and in PDF No strings attached
Previously searched by you
Consider again the two ways in which we can view the producer’s profit maximization problem. A: Suppose a homothetic production technology involves two inputs, labor and capital, and that its producer choice set is fully convex. (a) Illustrate the product$3.59
Add to cart
Consider again the two ways in which we can view the producer’s profit maximization problem. A: Suppose a homothetic production technology involves two inputs, labor and capital, and that its producer choice set is fully convex. (a) Illustrate the product
268 views 0 purchase
Course
Economics
Institution
University Of Delhi
Consider again the two ways in which we can view the producer’s profit maximization problem.
A: Suppose a homothetic production technology involves two inputs, labor and capital, and that its producer choice set is fully convex.
(a) Illustrate the production frontier in an isoquant graph with lab...
Consider again the two ways in which we can view the producer’s profit maximization
problem.
A: Suppose a homothetic production technology involves two inputs, labor and capital, and
that its producer choice set is fully convex.
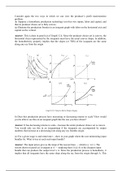
(a) Illustrate the production frontier in an isoquant graph with labor on the horizontal axis and
capital on the vertical.
Answer: This is done in panel (a) of Graph 12.4. Since the producer choice set is convex, the
horizontal slices represented by the isoquants must have the usual convex shape. In addition,
the homotheticity property implies that the slopes (or TRS) of the isoquants are the same
along any ray from the origin
b) Does this production process have increasing or decreasing returns to scale? How would
you be able to see this on an isoquant graph like the one you have drawn?
Answer: It has decreasing returns to scale—because the entire producer choice set is convex.
You would only see this in an isoquantmap if the isoquants are accompanied by output
numbers that increase at a decreasing rate along any ray fromthe origin.
(c) For a given wage w and rental rate r , show in your graph where the cost minimizing input
bundles lie. What is true at each such input bundle?
Answer: The input prices give us the slope of the isocost lines — which is (−w/r ). The
isocost drawn in panel (a) is tangent at A — implying that (ℓA,k A) is the cheapest input
bundle that can produce the output level x A. Since the production process is homothetic, it
implies that all isoquants have the same slope along the ray from the origin through A. This
The benefits of buying summaries with Stuvia:
Guaranteed quality through customer reviews
Stuvia customers have reviewed more than 700,000 summaries. This how you know that you are buying the best documents.
Quick and easy check-out
You can quickly pay through credit card or Stuvia-credit for the summaries. There is no membership needed.
Focus on what matters
Your fellow students write the study notes themselves, which is why the documents are always reliable and up-to-date. This ensures you quickly get to the core!
Frequently asked questions
What do I get when I buy this document?
You get a PDF, available immediately after your purchase. The purchased document is accessible anytime, anywhere and indefinitely through your profile.
Satisfaction guarantee: how does it work?
Our satisfaction guarantee ensures that you always find a study document that suits you well. You fill out a form, and our customer service team takes care of the rest.
Who am I buying these notes from?
Stuvia is a marketplace, so you are not buying this document from us, but from seller yashvidyapeeth. Stuvia facilitates payment to the seller.
Will I be stuck with a subscription?
No, you only buy these notes for $3.59. You're not tied to anything after your purchase.