Micro-economie 2019/2020
Chapter 1; Introduction
Microeconomics is the study of how individuals/firms make themselves as well off as
possible in a world of scarcity, and the consequences of those individuals decisions for
markets and the entire economy
- Individuals/firms allocate their limited resources to make themselves as well off as
possible
People make trade-off because they can’t have everything. A society faces 3 key trade-offs;
1) Which goods/services to produce
- If a society produces more cars, it must produce fewer of other goods/services, because
it has only a limited amount of resources available to produce goods
2) How to produce
- To produce a given level of output, a firm must use more of one input if it uses less of
another input
- For example; cracker and cookie manufacturers switch between palm oil and
coconut oil, depending on which is less expensive
3) Who gets the goods/services?
- The more of society’s goods/services you get, the less someone else gets
1
,Chapter 2; Supply and demand
Demand; the quantity of a good/service that consumers demand depends on price and
other factors such as consumers’ incomes and the prices of related goods
Quantity demanded; the amount of a good that consumers are willing to buy at a given price
during a specified period
Potential consumers decide how much of a good/service to buy based on its price, which is
expressed as an amount of money per unit of the good, and many other factors;
- Consumers’ taste
- Information about the use of a good
- Price of other goods
- Substitution goods (competing goods)
- A good/service that may be consumed instead of another good/service
- Tea - Coffee
- If the price of coffee goes up, there will be more demand for tea
- Complementary goods
- A good/service that is jointly consumed with another good/service
- Car - Petrol
- If the price of cars increases, we will buy fewer cars, then there will also be less
demand for petrol
- People’s income
- More wealth leads to more luxury items people buy
- Government rules and regulations
- Sales taxes increase the price that a consumer must spend on a good
- Government-imposed limits on the use of a good can affect demand
- Other factors
Although many factors influence demand, economists usually concentrate on how a
product’s price affects the quantity demanded
Demand function; shows the correspondence between the quantity demanded, price and
other factors that influence purchases
Let’s examine the demand function for coffee; 𝑄 = 𝐷(𝑝, 𝑝! , 𝑌)
- 𝑄 ; the quantity of coffee demanded
- 𝑝 ; price of coffee
- 𝑝! ; price of sugar
- 𝑌 ; consumers’ income
- 𝐷 ; coffee demand function
We assume that any other factors that are not explicitly listed in the demand function are
irrelevant or constant (such as the price of substitutes/complements, tastes, consumer
information)
2
,The general functional form; 𝑄 = 𝐷(𝑝, 𝑝! , 𝑌)
- It does not specify exactly how 𝑄 varies with the explanatory variables 𝑝 and 𝑌
Estimated world demand function for coffee beans; 𝑄 = 8.56 − 𝑝 − 0.3𝑝! + 0.1𝑌
- 𝑄 ; the quantity of coffee in millions of tons per year
- 𝑝 ; price of coffee in dollars per pound (lb)
- 𝑝! ; price of sugar in dollars per pound (lb)
- 𝑌 ; average annual household income in thousands of dollars
Example;
Given that the price of sugar is $0.20 per lb and the average income is $35 thousand per year
- 𝑝! = $0.20
- 𝑌 = $35
𝑄 = 8.56 − 𝑝 − 0.3𝑝! + 0.1𝑌
𝑄 = 8.56 − 𝑝 − 0.3($0.20) + 0.1($35)
𝑄 = 12 − 𝑝
Demand curve; a plot of the demand function that shows that quantity demanded at each
possible price, holding constant the other factors that influence purchases
- It is a concise summary of the answers to the question; “What happens to the quantity
demanded as the price changes, when all other factors are held constant?”
The estimated demand curve, 𝐷, for coffee shows the
relationship between the quantity demanded per
year and the price per lb
- The downward slope of the demand curve shows
that, holding other factors constant, consumers
demand a smaller quantity of a good when its
price is high and a larger quantity when the price
is low
- A change in price causes a movement along the
demand curve
𝑄 = 12 − 𝑝
- 𝑄 = 0 ----> 𝑝 = $12
- No quantity is demanded when the price is $12 per lb or higher
- 𝑝 = 0 ----> 𝑄 = 12
- People would consume 12 million tons of coffee per year if coffee were free
Law of Demand; consumers demand more of a good the lower the price
- A higher price results in a lower quantity demanded; downward sloping curve
- Negative relationship between demand and price
"# "#
If the demand function is 𝑄 = 𝐷(𝑝) then the Law of Demand says that "$ < 0, where "$ is
the derivative of the 𝐷 function with respect to 𝑝
3
,The derivative of the quantity of coffee demanded with respect to its price is;
"#
𝑄 = 12 − 𝑝 ------> "$
= −1
- The derivative is negative, so the Law of Demand holds
- A small change in the price causes an equal unit decrease in the quantity demanded
In general, if we look at a discrete, relatively large increase in the price, the change in the
quantity might not be proportional to the change for a small increase in the price
The slope of the demand curve is the reciprocal of the derivative of the demand function
"$ %
- Slope = "# = !"
!#
Example;
"# % %
𝑄 = 12 − 𝑝 ------> "$
= −1 ------> !" = &% = −1
!#
- The slope of the demand curve, 𝐷, is therefore −1
We can also calculate the slope of de demand curve with the rise-over-run formula;
'(!) ,-
- Slope = '*+ = ,.
Example;
$% $)' 12
Slope = &% 3(11(4+ 54+! $)' 6)7' = −$1 per million tons per year
- The slope tells us; to sell one more unit of coffee, the price must fall by $1
Thus we can calculate the slope of the demand curve in 2 ways;
"$ "#
1. Slope = "# = 1/ "$
'(!) ,-
2. Slope = '*+
= ,.
A change in any factor other than the price of the good itself causes a shift of the demand
curve
Movement along the demand curve;
- Price of a good change (𝑝)
Shift of the demand curve;
- A change in any factor other than the price of the good itself (𝑝! / 𝑌)
- (substitution goods, income, etc.)
4
,Example;
If the average income rises (𝑌) and the price of coffee (𝑝) remains constant, people buy
more coffee
Suppose that the average income rises from $35,000 per year to $50,000 per year
- 𝑌 = $50
- 𝑝! = $0.20
𝑄 = 8.56 − 𝑝 − 0.3𝑝! + 0.1𝑌
𝑄 = 8.56 − 𝑝 − 0.3(0.20) + 0.1(50)
𝑄 = 13.5 − 𝑝
The figure shows that the higher income causes the coffee
demand curve to shift 1.5 units to the right
- From 𝐷% to 𝐷8
Why does the demand function shift by 1.5 units?
9#
𝑄 = 8.56 − 𝑝 − 0.3𝑝! + 0.1𝑌 ----> 9: = 0.1
- Thus if income increases by $15 thousand, the quantity of coffee demanded rises by
0.1 x 15 = 1.5 units (holding other factors constant)
If we know the demand curve of each of two consumers, how do we determine the total
demand for the two consumers combined?
- The total quantity demanded at a given price is the sum of the quantity each consumer
demands at that price
Example;
- Demand function consumer 1; 𝑄% = 𝐷% (𝑝)
- Demand function consumer 2; 𝑄8 = 𝐷8 (𝑝)
At price 𝑝;
- Consumer 1 demands 𝑄% units
- Consumer 2 demands 𝑄8 units
The total demand of both consumers is the sum of the quantities each demands separately;
𝑄 = 𝑄% + 𝑄8 = 𝐷% (𝑝) + 𝐷8 (𝑝)
Quantity supplied; the amount of a good that firms want to sell during a given period at a
given price
Firms determine how much of a good to supply based on its price and other factors;
- Production costs
- Affects how much of a good a firm wants to sell
- As a firm’s cost rises, it is willing to supply less of the good
- Factors that affect cost also affect supply
- E.g. technological advance allows firms to produce a good at a lower cost and
causes the firm to supply more of that good
- Government rules and regulations
- Affect how much firms want to sell or may sell
- Taxes and many government regulations alter the costs of production
- Other regulations affect when and how firms may sell the product
5
,Supply function; shows the correspondence between the quantity supplied, price and other
factors that influence the number of units offered for sale
Let’s examine the supply function for coffee; 𝑄 = 𝑆(𝑝, 𝑝; )
- 𝑄 ; the quantity of coffee supplied
- 𝑝 ; price of coffee
- 𝑝; ; price of cocoa (key input in making chocolate, substitute good)
- 𝑆 ; coffee supply function
If the price of cocoa rises, many coffee farmers switch to producing cocoa
- Therefore, when the price of cocoa rises, the amount of coffee produced at any given
price falls
Estimated world supply function for coffee ; 𝑄 = 9.6 + 0.5𝑝 − 0.2𝑝;
- 𝑄 ; the quantity of coffee in millions of tons per year
- 𝑝 ; price of coffee in dollars per lb
- 𝑝; ; price of cocoa in dollars per lb
Example;
Given that the price of cocoa is $3 per lb
- 𝑝; = $3
𝑄 = 9.6 + 0.5𝑝 − 0.2𝑝;
𝑄 = 9.6 + 0.5𝑝 − 0.2($3)
𝑄 = 9 + 0.5𝑝
Supply curve; a plot of the supply function that shows the quantity supplied at each possible
price, holding constant the other factors that influence firms’ supply decisions
- It is a concise summary of the answers to the question; “What happens to the quantity
supplied as the price changes, when all other factors are held constant?”
The estimated supply curve, 𝑆, for coffee shows the
relationship between the quantity supplied per year
and the price per lb
- The upward slope of the supply curve shows that,
firms supply more coffee when its price is high and
less when the price is low
- A change in price causes a movement along the
supply curve
The derivative of the quantity of coffee supplied with respect to its price is;
"#
𝑄 = 9 + 0.5𝑝 ------> "$
= 0.5
- It shows that the quantity supplied increases by 0.5 units for each $1 increase in price
- Because the derivative is positive, the supply curve slopes upward
- There is NO Law of Supply, the supply curve does not have a particular slope!!
A change in any factor other than the product’s price causes a shift of the supply curve
6
,Movement along the supply curve;
- Products’ price change
Shift of the supply curve;
- A change in any factor other than the price of the good itself
- (government rules, cost of production, technological change, etc.)
Example;
If the price of cocoa increases from $3 to $6 per pound, the supply function becomes;
- 𝑝; = $6
𝑄 = 9.6 + 0.5𝑝 − 0.2𝑝;
𝑄 = 9.6 + 0.5𝑝 − 0.2($6)
𝑄 = 8.4 + 0.5𝑝
The figure shows that an increase in the price of cocoa
causes the coffee supply curve to shift 0.6 units to the left
- From 𝑆 % to 𝑆 8
Why does the supply function shift by 0.6 units?
9#
𝑄 = 9.6 + 0.5𝑝 − 0.2𝑝; ----> 9$ = −0.2
$
- Thus, a $3 increase in the price of cocoa causes a -0.2 x 3 = -0.6 units change in the
quantity of cocoa supplied at any price of cocoa
The total supply curve shows the total quantity of a product produced by all suppliers at
each possible price
- For example; the total supply curve of rice in Japan is the sum of the domestic and the
foreign supply curves of rice
Because the total supply curve is the horizontal sum of the domestic and foreign supply
curves, the total supply curve is flatter than each of the other two supply curves
7
,We can use this approach for deriving the total supply curve to analyze the effect of
government policies on the total supply curve
- Traditionally, the Japanese government has banned the importation of foreign rice
We want to determine how much less rice is supplied at any given price to the Japanese
market because of this ban
- Without a ban; the foreign supply curve is 𝑆<
- With a ban; the foreign supply curve is :𝑆<
- A ban on imports eliminates the foreign supply, so the foreign supply curve after the
ban is imposed, 𝑆̅< , is vertical line at 𝑄< = 0
- The import ban has no effect on the domestic supply curve, 𝑆 "
Quota; A limit that a government sets on the quantity of a foreign-produced good that may
be imported
- By absolutely banning the importation of rice, the Japanese government sets a quota of
zero on rice imports
- Sometimes government set positive quotas, 𝑄< > 0
- The foreign firms may supply as much as they want, 𝑄< , as long as they supply no
more than the quota; 𝑄< < 𝑄<
The supply and demand curves jointly determine the price and quantity at which
goods/services are bought and sold
- The demand curve shows the quantities that consumers want to buy at various prices
- The supply curve shows the quantities that firms want to sell at various prices
Unless the price is set so that consumers want to buy exactly the same amount that
suppliers want to sell, either some buyer cannot buy as much as they want or some sellers
cannot sell as much as they want
- When all traders are able to buy/sell as much as they want, we say that the market is in
equilibrium
Equilibrium; a situation in which participant want to change its behavior
- Equilibrium price; consumers want to buy the same quantity that firms want to sell
- Equilibrium quantity; the quantity that consumers buy and firms sell at the equilibrium
price
The supply and demand curve for coffee intersect at
point e, the market equilibrium
- Equilibrium price; $2 per lb
- Equilibrium quantity; 10 million tons per year
If the price were not at the equilibrium level,
consumers/firms would have an incentive to change
their behavior in a way that would drive the price ot
the equilibrium level
Disequilibrium; the quantity demanded would not equals the quantity supplied
8
,In summary;
- At any price other than the equilibrium price, either consumers or suppliers would be
unable to trade as much as they want
- These disappointed people would act to change the price, driving the price to the
equilibrium level
- The equilibrium price is called the market clearing price because it removes from the
market all frustrated buyers and sellers; the market has no excess demand or supply at
the market clearing price
If the variables we hold constant in the demand and supply functions do not change, an
equilibrium would persist indefinitely because none of the participants in the market would
apply pressure to change the price
- However, the equilibrium changes if a shock occurs so that one of the variables we were
holding constant changes
- Causing a shift in either the demand curve of the supply curve
Comparative statics; the method economists use to analyze how variables controlled by
consumers/firms react to a change in environmental variables (exogenous variables) that
they do not control
- Such environmental variables include the prices of substitutes, the prices of
complements, the income level of consumers, and the prices of inputs
The term comparative statics literally refers to comparing a static equilibrium to a static
equilibrium after the change
- Static equilibrium; an equilibrium at a point in time from before the change
We can determine the comparative statics properties of an equilibrium by examining the
effects of a discrete (relatively large) change in one environmental variable
- We can do so by solving for the before- and after-equilibria and comparing them using
mathematics or a graph
9
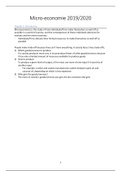
, Example Graph;
Suppose all the environmental variables remain constant except the price of cocoa, which
increases by $3 per pound
- Because the price of cocoa is not an argument to the demand function, the demand
curve does not shift
The increase in the price of cocoa causes the coffee supply curve to shift 0.6 units to the left
from 𝑆 % to 𝑆 8 at every possible price of coffee
At the original equilibrium price of coffee, $2, consumers still want
to buy 10 million tons, but suppliers are now willing to supply only
9.4 million tons at that price, so the market has an excess demand of
10 – 9.4 = 0.6
Market pressure forces the coffee price upward until it reaches the
new equilibrium, 𝑒8
At 𝑒8 , the new equilibrium price is $2.40, and the new equilibrium quantity is 9.6 million tons
- Thus, the increase in the price of cocoa causes the equilibrium price of coffee to rise by
$0.40 per lb, and the equilibrium quantity to fall by 0.4 million tons
The increase in the price of cocoa causes a shift of the supply curve and a movement along
the demand curve
Thus both methods show that an increase in the price of cocoa causes the equilibrium price
to rise and the equilibrium quantity to fall
10
The benefits of buying summaries with Stuvia:
Guaranteed quality through customer reviews
Stuvia customers have reviewed more than 700,000 summaries. This how you know that you are buying the best documents.
Quick and easy check-out
You can quickly pay through credit card or Stuvia-credit for the summaries. There is no membership needed.
Focus on what matters
Your fellow students write the study notes themselves, which is why the documents are always reliable and up-to-date. This ensures you quickly get to the core!
Frequently asked questions
What do I get when I buy this document?
You get a PDF, available immediately after your purchase. The purchased document is accessible anytime, anywhere and indefinitely through your profile.
Satisfaction guarantee: how does it work?
Our satisfaction guarantee ensures that you always find a study document that suits you well. You fill out a form, and our customer service team takes care of the rest.
Who am I buying these notes from?
Stuvia is a marketplace, so you are not buying this document from us, but from seller ek99. Stuvia facilitates payment to the seller.
Will I be stuck with a subscription?
No, you only buy these notes for $3.21. You're not tied to anything after your purchase.