Statistical Methods for the Social Sciences, Global Edition
Samenvatting van het vak Statistiek II practicums aan de Rijksuniversiteit Groningen. Uitgebreide college aantekeningen, gemarkeerde (blauwe) delen extra belangrijk/kern. Tweedejaars vak (of Pre-Master vak) voor de bachelor Psychologie. Alles om de JASP toetsen van Statistiek II te kunnen behalen. ...
statistical methods for the social sciences fifth edition
Connected book
Book Title:
Author(s):
Edition:
ISBN:
Edition:
More summaries for
summary statistics 1 - psychology
Summary Statistics/Statistiek 2 (VU)
Summary Statistics/Statistiek 1 VU
All for this textbook (14)
Written for
Rijksuniversiteit Groningen (RuG)
Bachelor Psychology
Statistiek 2 (PSBA207)
All documents for this subject (9)
Seller
Follow
Feia
Reviews received
Content preview
Practica statistiek – week 2
17-09-2020
Introductie
Britt koot
b.e.l.koot@rug.nl vragen over practicum na nakijken
12 online lessen
Week 6 en 12 – toetsen JASP – dus goed deelnemen
Stof in HC – kort terug in practica – slides erbij houden met practicum
Simpele lineaire regressie: inferentie
Doel: het bepalen van de mate van de samenhang tussen variabelen x en y
Voor de populatie geldt: Y=α + βx
Voor de sample geldt: ^y =¿a+bx
o a= schatting van α
o b= schatting van β
Voorwaarden:
o De residuen zijn normaal verdeeld met
gelijke SD
o De residuen zijn onafhankelijk van x
Simpele lineaire regressie: in JASP
In JASP:
o Regression >> Linear Regression
o Afhankelijke en onafhankelijke invullen
Afhankelijke variabele:
o Vetpercentage (y)
Onafhankelijke variabele:
o Leeftijd (x)
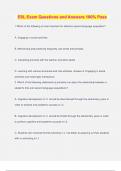
Simpele lineaire regressie: regressievergelijking
^y =¿a+bx regressievergelijking opstellen
o a=2.507 (staat bovenaan)
Aangeduid met constant (i.p.v.
intercept)
o b=0.549 (staat onderaan)
o X = leeftijd
Dus: Vet% = 2.507 + 0.549 * leeftijd
,Simpele lineaire regressie: betrouwbaarheidsinterval berekenen
Niet voor a en b – wel kunnen!!
Correlatie inferentie
Correlatiecoëfficiënt (r):
o Geeft de richting en de sterkte van de lineaire relatie
tussen x en y
Gebruik r om de populatie richtingscoëfficiënt ( ρ ) te schatten
o Voor a en b - populatieparameter schappen
Maar r is NIET normaal verdeeld, dus geen schatting m.b.v. BHI’s mogelijk
Dus transformeer r zodat het (ongeveer) normaal verdeeld is
o r omzetten met Fisher-z-transformatie
o log. = logaritme (dus niet log – maar ln op rekenmachine)
Gebruik de Fisher z-transformatie
Nu kan je een BHI opstellen – staat in HC-slides
o Interval omzetten
o De uitkomst is het BHI van ρ
o Aanvinken betrouwbaarheidsinterval in JASP
Dan nog niet antwoord
o Terug transformeren
o Interval = LB en UB
o Dan antwoord
o Belangrijk om te kunnen!!! Komt sowieso op tentamen!
Tips voor vandaag – opdracht 1/week 2 – datafile apeldoorn
Opgave 2: Zie hoorcollege 2, slide 18 t/m 21.
Opgave 9a: Houd altijd rekening met de context en betekenis van de variabelen.
Opgave 10: De variabele s staat voor de RMSE (de geschatte SD van de residuen)
Model validiteit: assumpties – belangrijk om te weten!
1. Onafhankelijkheid
o Alle observaties zijn onafhankelijk van elkaar.
o Random sampling.
2. Lineairiteit
o Relatie tussen x en E(y) is een rechte lijn.
3. Homoscedasticiteit
o De residuen hebben een distributie met constante variantie
4. Residuen hebben een normale verdeling.
Model validiteit: influential points
Influential points (outliers)
Veel invloed op de slope (b)
Kan leiden tot verkeerde conclusies
o Oplossing: Cook’s Distance (vraag 7 & 8)
Causaliteit en associatie
Relaties – belangrijk om te weten!
Correlatie betekent NIET causative
o Correlatie ≠ causative
o Valse associatie
Causatie betekent wel correlatie
Multivariate relaties
A en B kunnen op verschillende manieren gerelateerd zijn
1. Directe causatie
2. Valse associatie
3. Ketting relatie
4. Interactie variabele – belangrijk om te weten
5. Toeval
Valse associatie
A en B hebben niet direct invloed op elkaar
Ze hebben gezamenlijke factor C
C is een lurking variable
Kettingrelatie
A veroorzaakt niet direct B
A veroorzaakt C, wat B veroorzaakt
The benefits of buying summaries with Stuvia:
Guaranteed quality through customer reviews
Stuvia customers have reviewed more than 700,000 summaries. This how you know that you are buying the best documents.
Quick and easy check-out
You can quickly pay through credit card or Stuvia-credit for the summaries. There is no membership needed.
Focus on what matters
Your fellow students write the study notes themselves, which is why the documents are always reliable and up-to-date. This ensures you quickly get to the core!
Frequently asked questions
What do I get when I buy this document?
You get a PDF, available immediately after your purchase. The purchased document is accessible anytime, anywhere and indefinitely through your profile.
Satisfaction guarantee: how does it work?
Our satisfaction guarantee ensures that you always find a study document that suits you well. You fill out a form, and our customer service team takes care of the rest.
Who am I buying these notes from?
Stuvia is a marketplace, so you are not buying this document from us, but from seller Feia. Stuvia facilitates payment to the seller.
Will I be stuck with a subscription?
No, you only buy these notes for $3.45. You're not tied to anything after your purchase.