Exam (elaborations)
MATH 225N Week 3 Central Tendancy Question and Answers: 2019(GRADED A)/(Download To Score An A)
- Course
- MATH 225N MATH
- Institution
- Chamberlain College Nursing
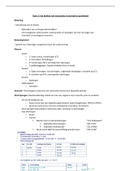
Given the following box-and-whisker plot, decide if the data is skewed or symmetrical. Which of the following frequency tables show a skewed data set? Select all answers that apply. Which of the fol lowing frequency tables show a skewed data set? Select all answers that apply. Which of the followin...
[Show more]