Summary
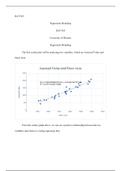
Summary DAT 565 Week 5.docx DAT/565 Regression Modeling DAT/565 University of Phoenix Regression Modeling The first scatter plot will be analyzing two variables, which are Assessed Value and Floor Area. From the scatter graph above, we can see a positive
- Course
- University Of Phoenix UoP
- Institution
- University Of Phoenix
DAT 565 Week DAT/565 Regression Modeling DAT/565 University of Phoenix Regression Modeling The first scatter plot will be analyzing two variables, which are Assessed Value and Floor Area. From the scatter graph above, we can see a positive relationship between the two variables since ther...
[Show more]


