Information Systems
Boston University
Here are the best resources to pass Information Systems. Find Information Systems study guides, notes, assignments, and much more.
All 1 results
Sort by

-
final_Exam.pdf
- Exam (elaborations) • 8 pages • 2023
-
- $7.99
- + learn more
You may find the following files helpful throughout the exam:
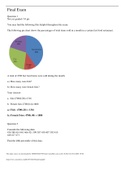
The following pie chart shows the percentages of total items sold in a month in a certain fast food restaurant.
A total of 4700 fast food items were sold during the month.
a.) How many were fish?
b.) How many were french fries?
Your Answer:
a. fish 4700(0.28)=1316
b. French fries 4700(0.4)=1880
a.) Fish : 4700(.28) = 1316
b.) French Fries: 4700(.40) = 1880
Question 2
Consider the following data: 430 3...
Exam (elaborations)
final_Exam.pdf
Last document update:
ago
You may find the following files helpful throughout the exam: The following pie chart shows the percentages of total items sold in a month in a certain fast food restaurant. A total of 4700 fast food items were sold during the month. a.) How many were fish? b.) How many were french fries? Your Answer: a. fish 4700(0.28)=1316 b. French fries 4700(0.4)=1880 a.) Fish : 4700(.28) = 1316 b.) French Fries: 4700(.40) = 1880 Question 2 Consider the following data: 430 3...
$7.99
Add to cart

Make study stress less painful
Study stress? For sellers on Stuvia, these are actually golden times. KA-CHING! Earn from your study resources too and start uploading now. Discover all about earning on Stuvia
Study stress? For sellers on Stuvia, these are actually golden times. KA-CHING! Earn from your study resources too and start uploading now. Discover all about earning on Stuvia


