University Of Maryland - Baltimore
Latest uploads at University Of Maryland - Baltimore. Looking for notes at University Of Maryland - Baltimore? We have lots of notes, study guides and study notes available for your school.
-
346
- 0
-
29
All courses for University Of Maryland - Baltimore
- IFSM 201 other 15
- IFSM 201 WEEK 1 IFSM 201 WEEK 1 1
- IFSM 201 WEEK 4 IFSM 201 WEEK 4 1
- IFSM 300 1
- IFSM 300 - System Recommendation Chesapeake IT Stage 4 IFSM 300 1
- IFSM 300 Final Exam. 1
- IFSM 461 1
- IFSM300 IFSM300 1
- Information Technology for Management: Digital Strategies for Insight, Action, and Sustainable Performance 1
- NURS 362 Comprehensive Assessment Completed Shadow Health 2
- NURS 462 1
- NURS 511 1
- NURSING 350 NURSING350 3
- NURSING 362 1
- NUTR 100 NUTR 100 17
- NUTR 100 Final Exam With Essay 1
- NUTR 100 Week 8 Final Exam _ 100% CORRECT ANSWERS 1
- NUTR 100 Week 8 Final Exam Nutrition Questions And Answers NUTR 100 4
- NUTR 100 Week 8 Final Exam- Questions and Answers 3
- NUTR 100 Week 8 Final Exam-Nutrient 1
- NUTR 100 Week 8 Final Exam-Questions and Answers 2
- NUTR100 2
- NUTRI 100 NUTRI 100 Week 1 9
- NUTRI 100 QUIZ 7 Nutrition & Society; Achieving Optimal Health NUTR100 2
- Nutrition NUTR 100 1
- NUTRITION 100 FINAL EXAM 1
- NUTRITION 100 FINAL EXAM STUDY 1
- Shadow health peds asthma peds shadow health peds asthma peds 5580 1
- SOC 101 1
- SOCIOLOGY 100 11
- Sophia STATS200 1
- Sophia Intro to Stats Unit 2 Milestone 2 1
- Sophia Intro to Stats Unit 2 Milestone 3 Sophia Intro to Stats Unit 2 Milestone 2 1
- Sophia __ Intro to Stats Unit 5 Milestone 5 STAT 200 1
- Sophia __ Microeconomics Final Milestone FINC 306 1
- Sophia __ Microeconomics Unit 3 Milestone 3 FINC 306 1
- Sophia __ Microeconomics Unit 4 Milestone 4. 1
- STAT 200 STAT200 42
- STAT 200 ALL QUIZZES BUNDLED TOGETHER VERIFIED A+ STAT 200 ALL QUIZZES BUNDLED TOGETHER 1
- Stat 200 Midterm Exam Verified A+ Latest Update Stat 200 Midterm Exam 1
- Stat 200 Quiz 1 STAT200 1
- STAT 200 Week 6 Homework Problems STAT200 2
- STAT 200 Week 7 Homework Problems 2
- STAT200 9
- STATISTICS 200 STATISTICS200 2
- STATISTICS 200-6367 1
- STATISTICS STAT 200 1
Latest notes & summaries University Of Maryland - Baltimore
Exam (elaborations) STAT 200 Week 6 Homework Problems STAT 200 Week 6 Homework Problems 9.1.2 Many high school students take the AP tests in different subject areas. In 2007, of the 144,796 students who took the biology exam 84,199 of them were female. In that same year, of the 211,693 students who took the calculus AB exam 102,598 of them were female ("AP exam scores," 2013). Estimate the difference in the proportion of female students taking the biology exam and female students taking the ...
Exam (elaborations) STAT 200 Week 3 Homework Problems STAT 200 Week 3 Homework Problems 4.1.4 A project conducted by the Australian Federal Office of Road Safety asked people many questions about their cars. One question was the reason that a person chooses a given car, and that data is in table #4.1.4 ("Car preferences," 2013). Table #4.1.4: Reason for Choosing a Car Safety Reliability Cost Performance Comfort Looks 84 62 46 34 47 27 Find the probability a person chooses a car for each of t...
Exam (elaborations) STAT 200 Week 4 Homework Problems STAT 200 Week 4 Homework Problems 6.1.2 1.) The commuter trains on the Red Line for the Regional Transit Authority (RTA) in Cleveland, OH, have a waiting time during peak rush hour periods of eight minutes ("2012 annual report," 2012). a.) State the random variable. x=waiting time during peak hours b.) Find the height of this uniform distribution. 1/(8-0)=0.125 c.) Find the probability of waiting between four and five minutes. P(4<x<...
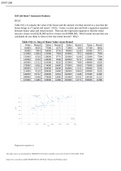
Exam (elaborations) STAT 200 Week 7 Homework Problems STAT 200 Week 7 Homework Problems 10.1.2 Table #10.1.6 contains the value of the house and the amount of rental income in a year that the house brings in ("Capital and rental," 2013). Create a scatter plot and find a regression equation between house value and rental income. Then use the regression equation to find the rental income a house worth $230,000 and for a house worth $400,000. Which rental income that you calculated do you think...
Exam (elaborations) STAT 200 Quiz 2 UMUC STAT 200 Quiz 2 Earned a grade of 96. Beware of question 31and 33 1. (1) The singular form of the word “dice” is “die”. Tom was throwing a six-sided die. The first time he threw, he got a three; the second time he threw, he got a three again. What’s the probability of getting a three at the third time? 1/6 2. (2) There are 30 table tennis balls in the box: 6 are green, 10 are red, and 14 are yellow. If you shake the box and then randomly selec...
Exam (elaborations) STAT 200 Week 1 Homework Problems STAT 200 Week 1 Homework Problems 1.1.4 To estimate the percentage of households in Connecticut which use fuel oil as a heating source, a researcher collects information from 1000 Connecticut households about what fuel is their heating source. State the individual, variable, population, sample, parameter, and statistic Individual - Households in Connecticut. Variable - Percentage of households in Connecticut which use fuel oil as a heating ...
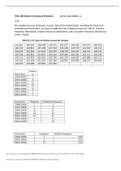
Exam (elaborations) STAT 200 Week 2 Homework Problems STAT 200 Week 2 Homework Problems 2.2.2 The median incomes of females in each state of the United States, including the District of Columbia and Puerto Rico, are given in table #2.2.10 ("Median income of," 2013). Create a frequency distribution, relative frequency distribution, and cumulative...
STAT 200 Week 7 Homework Problems 10.1.2 Table #10.1.6 contains the value of the house and the amount of rental income in a year that the house brings in ("Capital and rental," 2013). Create a scatter plot and find a regression equation between house value and rental income. Then use the regression equation to find the rental income a house worth $230,000 and for a house worth $400,000. Which rental income that you calculated do you think is closer to the true rental income? Why? Table ...
STAT 200 Week 4 Homework Problems 6.1.2 1.) The commuter trains on the Red Line for the Regional Transit Authority (RTA) in Cleveland, OH, have a waiting time during peak rush hour periods of eight minutes ("2012 annual report," 2012). a.) State the random variable. x=waiting time during peak hours b.) Find the height of this uniform distribution. 1/(8-0)=0.125 c.) Find the probability of waiting between four and five minutes. P(4<x<5)=(5-4)*0.125=0.125 d.) Find the probabilit...

