STAT 200
University Of Maryland - College Park
Page 2 out of 33 results
Sort by
-
STAT200 - Assignment #1: Descriptive Statistics Data Analysis Plan (complete solutions)
- Summary • 5 pages • 2021
-
- $11.49
- + learn more
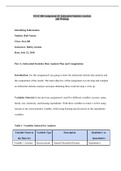
University of Maryland University College STAT200 - Assignment #1: Descriptive Statistics Data Analysis Plan Score: 42 out of 50 Identifying Information Student (Full Name): DeNedra Hodge Class: STAT 200 6366 Introduction to Statistics Instructor: Date: 3 June 2018 Scenario: The sample data was... [Show more]
-
STAT 200-Midterm Exam 1| GRADED A+
- Exam (elaborations) • 11 pages • 2021
-
- $10.00
- + learn more
STAT 200-Midterm Exam 1STAT 200-Midterm Exam 1 Instructor: Dr. S Therianos Name: Johnatho Hayes Multiple-Choice: Choose exactly ONE answer for each question. There are 40 problems for 2.5 points each for a total of 100 points. 01. An Internet study asked respondents to indicate their education level on the following scale: Less than High School, High School, Some College, College +. Which of the following statements is (are) true? A. Education level is a qualitative variable. B. Education l...
-
STAT 200 Week 2 Homework Problems
- Exam (elaborations) • 10 pages • 2021
-
- $11.00
- + learn more
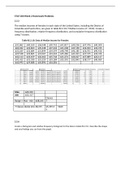
STAT 200 Week 2 Homework Problems 2.2.2 The median incomes of females in each state of the United States, including the District of Columbia and Puerto Rico, are given in table #2.2.10 ("Median income of," 2013). Create a frequency distribution, relative frequency distribution, and cumulative frequency distribution using 7 classes. Table #2.2.10: Data of Median Income for Females $31,862 $40,550 $36,048 $30,752 $41,817 $40,236 $47,476 $40,500 $60,332 $33,823 $35,438 $37,242 $31,238 $3...
STAT 200 Week 1 Homework Problems
-
STAT 200 Assignment #3: Inferential Statistics Analysis and Writeup
- Exam (elaborations) • 7 pages • 2021
-
- $8.00
- + learn more
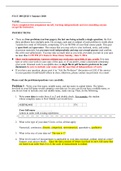
STAT 200 Assignment #3: Inferential Statistics Analysis and WriteupSTAT 200 Assignment #3: Inferential Statistics Analysis and Writeup Identifying Information Student (Full Name): Class: Stat 200 Instructor: Bobby Jordan Date: July 22, 2018 Part A: Inferential Statistics Data Analysis Plan and Computation Introduction: For this assignment I am going to show the inferential statistic data analysis and the computation of the results. The main objective of this assignment is to deve...
Assignment #3_ Inferential Statistics Analysis and Writeup - Template.
-
STAT 200 QUIZ 1 Summer 2020
- Exam (elaborations) • 9 pages • 2021
-
- $10.00
- + learn more
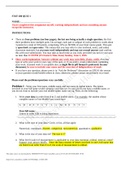
STAT 200 QUIZ 1 Summer 2020STAT 200 QUIZ 1 Summer 2020 NAME: I have completed this assignment myself, working independently and not consulting anyone except the instructor. INSTRUCTIONS • There are four problems (on four pages), the last one being actually a single question; the first three problems have multiple parts. On average, each part or subpart of each problem is worth about 3 points for a total of 100 points, comprising 12% (or 60/500) of your final course grade. This q...
-
Quiz 1 - STAT 200
- Exam (elaborations) • 9 pages • 2021
-
- $9.49
- + learn more
Write your data in order from A to Z and double check. For example, the student whose complete name is First Middle Last would have What is the type of your data? Circle, or list, all that apply: What is the size of your data set?
-
STAT 200: Introduction to Statistics Homework #4 Solutions Complete A+ Guide(Download to score an A)
- Exam (elaborations) • 28 pages • 2021
-
- $13.99
- + learn more
STAT 200: Introduction to Statistics Homework #4 Solutions 1. (3 points): The commuter trains on the Red Line for the Regional Transit Authority (RTA) in Cleveland, OH, have a waiting time during p eak rush hour periods of eight minutes ("2012 annual report," 2012). a.) State the random variable. The random variable is given by: x = waiting times for the RTA b.) Find the height of this uniform distribution. It will be beneficial to draw a diagram of this: We know that the sum of all probab...
![STAT 200 Week 2 Homework Problems [With Complete Solutions] A+ Guide](/docpics/60e1db045f898_1199712.jpg)
-
STAT 200 Week 2 Homework Problems [With Complete Solutions] A+ Guide
- Exam (elaborations) • 16 pages • 2021
-
- $13.49
- + learn more
Class: STAT 200 Week 2 Homework Problems 2.2.2 The median incomes of females in each state of the United States, including the District of Columbia and Puerto Rico, are given in table #2.2.10 ("Med ian income of," 2013). Create a frequency distribution, relative frequency distribution, and cumulative frequency distribution using 7 classes. Table #2.2.10: Data of Median Income for Females $31,862 $40,550 $36,048 $30,752 $41,817 $40,236 $47,476 $40,500 $60,332 $33,823 $35,438 $37,242 $31,238...

That summary you just bought made someone very happy. Also get paid weekly? Sell your study resources on Stuvia! Discover all about earning on Stuvia

