ACCT 282
University of Cincinnati
Here are the best resources to pass ACCT 282. Find ACCT 282 study guides, notes, assignments, and much more.
All 1 results
Sort by
-
Stat-1031 (Introduction to Statistics) Test 1 Review
- Exam (elaborations) • 14 pages • 2021
- $10.49
- + learn more
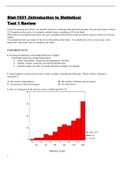
I. Picturing Distributions with Graphs (Reference Chapter 1) Important objectives include being able to
• define: individuals, categorical and quantitative variables
• identify: outliers, symmetric and skewed distributions.
• interpret graphs: pie chart, bar graph, histogram, dotplot, for example
1. Stream quality is based on the levels of many variables, including the following. Which of these variables is quantitative?
A. The amount of phosphorus B. The number of distinct specie...
Exam (elaborations)
Stat-1031 (Introduction to Statistics) Test 1 Review
Last document update:
ago
I. Picturing Distributions with Graphs (Reference Chapter 1) Important objectives include being able to • define: individuals, categorical and quantitative variables • identify: outliers, symmetric and skewed distributions. • interpret graphs: pie chart, bar graph, histogram, dotplot, for example 1. Stream quality is based on the levels of many variables, including the following. Which of these variables is quantitative? A. The amount of phosphorus B. The number of distinct specie...
$10.49
Add to cart

And that's how you make extra money

