MATH 225N Week 3 Central Tendency Questions and Answers (MATH 225N)
Chamberlain College of Nursing
All 5 results
Sort by

-
MATH 225N WEEK 3 CENTRAL TENDENCY QUESTIONS AND ANSWERS
- Exam (elaborations) • 30 pages • 2021
-
- $15.99
- + learn more
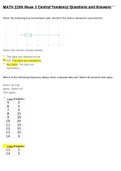
MATH 225N Week 3 Central Tendency Questions and Answers Given the following box-and-whisker plot, decide if the data is skewed or symmetrical. Which of the following frequency tables show a skewed data set? Select all answers that apply. Which of the following frequency tables show a skewed data set? Select all answers that apply. For the following dataset, you are interested to determine the “spread” of the data……Would you employ calculations for the sample standard deviation, or ...

-
MATH 225N WEEK 3 CENTRAL TENDENCY QUESTIONS AND ANSWERS
- Exam (elaborations) • 26 pages • 2021
-
- $15.49
- + learn more
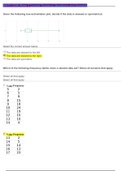
MATH 225N Week 3 Central Tendency Questions and Answers Given the following box-and-whisker plot, decide if the data is skewed or symmetrical. Which of the following frequency tables show a skewed data set? Select all answers that apply. Which of the following frequency tables show a skewed data set? Select all answers that apply. For the following dataset, you are interested to determine the “spread” of the data……Would you employ calculations for the sample standard deviation, or ...

-
MATH 225N WEEK 3 CENTRAL TENDENCY QUESTIONS AND ANSWERS
- Exam (elaborations) • 26 pages • 2021
-
- $15.49
- + learn more
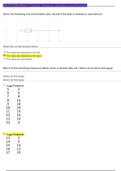
MATH 225N Week 3 Central Tendency Questions and Answers Given the following box-and-whisker plot, decide if the data is skewed or symmetrical. Which of the following frequency tables show a skewed data set? Select all answers that apply. Which of the following frequency tables show a skewed data set? Select all answers that apply. For the following dataset, you are interested to determine the “spread” of the data……Would you employ calculations for the sample standard deviation, or ...

Do you wonder why so many students wear nice clothes, have money to spare and enjoy tons of free time? Well, they sell on Stuvia! Imagine your study notes being downloaded a dozen times for $15 each. Every. Single. Day. Discover all about earning on Stuvia


