MATH 534 APPLIED MANAGERIAL STATISTICS (MATH534)
Devry University
Page 4 out of 67 results
Sort by
-
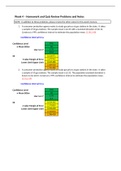
MATH 534 Week 4 Addendum Homework-Quiz Review Problems and Notes
- Other • 5 pages • 2023
- Available in package deal
-
- $17.99
- + learn more
1. Aconsumerprotectionagencywantstostudygaspricesatgasstationsinthestate.Ittakesasample of 50 gas stations.The sample mean is $2.35 with a standard deviation of $0.12.Constructa99%confidenceintervaltoestimatethepopulationmean.(2.30,2.40) 2. Aconsumerprotectionagencywantstostudygaspricesatgasstationsinthestate.Ittakesasample of 50 gas stations.The sample mean is $2.35. The population standard deviaiton isknown to be $0.10. Construct a 99% confidence interval to estimate the population mean.(2.31...
-
MATH 534 Week 7 Course Project Final Part C Regression and Correlation Analysis
- Other • 4 pages • 2023
- Available in package deal
-
- $27.99
- + learn more
MATH 534 Week 7 Course Project Final Part C Regression and Correlation Analysis For this regression analysis we will choose X1-calls as Independent Variable and Y-Sales asDependentVariable.ThereasonbehinditisbecausethecorrelationcoefficientbetweenTimeandYearswith Salesisweakerthan Callswith Sales.

-
MATH 534 Week 5 Homework Problems (v2)
- Other • 4 pages • 2023
- Available in package deal
-
- $17.99
- + learn more
1 In hypothesis testing the statistical conclusion is either to reject or not to reject then ull hypothesis based on the sample data. Which of the following statements is true?

-
MATH 534 Week 6 Quiz (v2)
- Other • 3 pages • 2023
- Available in package deal
-
- $17.99
- + learn more
3 If the correlation coefficient between variables X and Y is roughly zero, then 6 In the equation y = m x + b, which represents a straight lime, b is the 7 If the relationship between y and x is given by the equation y = 1.57 − 0.0407 x, the slope coefficient 0.0407 means this for every unit increas
-
MATH 534 Week 7 Discussion Predictive Analytics (Keller)
- Other • 3 pages • 2023
- Available in package deal
-
- $14.99
- + learn more
MATH 534 Week 7 Discussion Predictive Analytics (Keller) Predictiveanalyticsisaninnovativeanalyticsdivisionthatuseshistoricaldatacombinedwith mathematical simulation, data mining techniques and machine learning to makeforecasts about future results.In order to detect threats and prospects, businessesemploy predictiveanalytics tofindtrendsin thisknowledge.
-
MATH 534 Week 4 Discussion Confidence Intervals in Business (Keller)
- Other • 3 pages • 2023
- Available in package deal
-
- $14.99
- + learn more
Confidenceintervalsrepresenttherangeofuncertaintyassociatedwiththeestimation of a statistic (mean, proportion, or standard deviation, etc.). There is always a risk ofsampling error associated with an estimate. Confidence intervals are useful forestablishing bounds for estimating, in particular, the mean or standard deviation, butalso regression coefficients, proportions, frequency rates, and differences betweenpopulations. Also, a 95% confidence interval indicates that for 19 out of 20 samplest...

-
MATH 534 Week 2 Discussion Changing Probabilities into Conditional Probabilities (Keller)
- Other • 3 pages • 2023
- Available in package deal
-
- $17.99
- + learn more
MATH 534 Week 2 Discussion: Changing Probabilities into Conditional Probabilities Describe a situation where you see probabilities or might see probabilities. Then present thisprobabilityasaconditionalprobability.Inresponse,otherstudentscanmakeassumptionsaboutthe conditional probability table that could accompany such a situation and pose a question for aspecificprobability.Finally,athirdstudentcanshowtheworkofsolvingtheprobability.Yourfirstpost should start a newprobabilitydiscussiononly
-
MATH 534 Week 6 Discussion Regression Analysis (Keller)
- Other • 3 pages • 2023
- Available in package deal
-
- $17.99
- + learn more
MATH 534 Week 6 Discussion Regression Analysis (Keller) Here,wearetalkingaboutregressionanalysis.Regressionanalysisreferstoa statisticalmethodofmodelingtherelationshipsbetweendifferentvariables(dependentand independent). It is used to describe and analyze relationships between data. Also,the regression analysis is used to make predictions, the relationships between databeingusedasabasis forforecastinganddesigningapredictionmodel.

-
MATH 534 Week 5 Discussion Hypothesis Testing.
- Other • 5 pages • 2023
- Available in package deal
-
- $16.99
- + learn more
MATH 534 Week 5 Discussion Hypothesis Testing.

-
MATH 534 Week 5 Discussion Hypothesis Testing.
- Other • 5 pages • 2023
- Available in package deal
-
- $9.99
- + learn more
MATH 534 Week 5 Discussion Hypothesis Testing.

That summary you just bought made someone very happy. Also get paid weekly? Sell your study resources on Stuvia! Discover all about earning on Stuvia


