Boxplot - Study guides, Class notes & Summaries
Looking for the best study guides, study notes and summaries about Boxplot? On this page you'll find 222 study documents about Boxplot.
Page 2 out of 222 results
Sort by
-
Qlik Sense Business Analyst Certification Rated A+
- Exam (elaborations) • 8 pages • 2024
-
- $9.99
- + learn more
Qlik Sense Business Analyst Certification Rated A+ AA: Container Allows you to put multiple viz in a limited space and user can toggle through AA: Landing sheet you can select a sheet to be the landing page for your app, Create a bookmark and set it as default Advanced Authoring Advanced authoring are ways to customize sheets and how the space is used AGGR Used with other aggregate function (e.g. sum, max), API help automate tasks Attunity Aka Replicate, Gives ability to rep...
-
Green Packet MC Questions and Answers Already Passed
- Exam (elaborations) • 43 pages • 2024
-
- $11.49
- + learn more
Green Packet MC Questions and Answers Already Passed Of the following dotplots, which represents the set of data that has the greatest standard deviation? B split in half A random sample of 374 United States pennies was collected, and the age of each penny was determined. According to the boxplot below, what is the approximate interquartile range (IQR) of the ages? graph A 8 B 10 C 16 D 40 E 50 C 16 graph The histogram above shows the number of minute...
-
STAT 250 GMU EXAM 1 QUESTIONS AND ANSWERS 100% PASS
- Exam (elaborations) • 14 pages • 2024
-
- $9.99
- + learn more
STAT 250 GMU EXAM 1 QUESTIONS AND ANSWERS 100% PASS 2 main components of categorical distribution -Mode (typical/ most frequent outcome) -Variability (or diversity in outcomes) Appropriate graphs for Categorical data -Pie chart -Bar graph Appropriate graphs for Numerical data -Dotplot -Histogram -Stemplot Appropriate measures of center & spread for SKEWED distributions Center- Median Spread- Interquartile Range (The median is not affected by outliers and its value doess not ...
-
BSAN 160 Exam Review All Correct (A+ Graded)
- Exam (elaborations) • 19 pages • 2024
-
- $13.99
- + learn more
T or F:Decision support system are computer-based support systems that integrate individuals' expertise and computer capabilities, and they have precise definitions agreed to by practitioners. - correct answers False Business Intelligence (BI) - correct answers is an umbrella term that combines architectures, databases, analytical tools, applications, and methodologies T or F: Data is a collection of observations, experiments, and experiences that do not necessarily represent absolute fac...
-
green packet MC Correctly Answered Questions | UpToDate | Already Graded A+
- Exam (elaborations) • 39 pages • 2024
-
- $13.99
- + learn more
Of the following dotplots, which represents the set of data that has the greatest standard deviation? : B split in half A random sample of 374 United States pennies was collected, and the age of each penny was determined. According to the boxplot below, what is the approximate interquartile range (IQR) of the ages? graph A 8 B 10 C 16 2 | P a g e D 40 E 50 : C 16 graph The histogram above shows the number of minutes needed by 45 students to finish playing a computer ga...
-
Introduction to Statistics Notes Latest Verified Review 2023 Practice Questions and Answers for Exam Preparation, 100% Correct with Explanations, Highly Recommended, Download to Score A+
- Summary • 20 pages • 2023
-
- $10.49
- + learn more
Introduction to Statistics Notes Latest Verified Review 2023 Practice Questions and Answers for Exam Preparation, 100% Correct with Explanations, Highly Recommended, Download to Score A+ Covers basic graphs and descriptive statistics for both categorical and quantitative variables This is what you would do as a “preliminary analysis” for a variable. Recall: a data set can have multiple variables in it. These chapters focus on mostly univariate (single variable) analyses. There is on...
-
Probability and Statistics, WGU C955 Questions and Answers (Graded A)
- Exam (elaborations) • 4 pages • 2023
- Available in package deal
-
- $10.99
- + learn more
Probability and Statistics, WGU C955 Questions and Answers (Graded A) Probability and Statistics, WGU C955 Questions and Answers (Graded A) Probability and Statistics, WGU C955 Questions and Answers (Graded A)Boxplot - ANSWER-an image that has min, Q1, median, Q3, max Histogram - ANSWER-A graphical representation -- bars, measuring the frequency within each interval Skewed right - ANSWER-Not a symmetric distribution, the tail is on the right, i.e. extra stuff on the right Meas...
-
Statistics final wgu academy exam questions and answers
- Exam (elaborations) • 6 pages • 2024
-
- $10.69
- + learn more
Statistics final wgu academy exam questions and answers Categorical variables that there is no natural order among the categories nominal variables Categorical variables where there is natural order among the categories (low-high) ordinal variable A measurement which makes sense to talk about the difference between values but not the ratio between values interval Quantitive variables where is makes sense to talk about the difference in ratios. (Income, weight) ratio Valu...

-
STA 2023 Test 1 GRADED A+ (ACTUAL TEST ) Questions and Answers (Solved)
- Exam (elaborations) • 16 pages • 2023
-
- $10.99
- + learn more
STA 2023 Test 1 GRADED A+ (ACTUAL TEST ) Questions and Answers (Solved) 1. interquartile range (IQR) Answer: Q3 Q1 2. outlier n a modified boxplot Answer: above Q3, by an amount greater than 1.5 × IQRor below Q1, by an amount greater than 1.5 × IQR. 3. modified boxplot Answer: regular boxplot constructed with these modifications: 1.) A special symbol (such as an asterisk or point) is used to identify outliers asdefined above 2.) the solid horizontal line extends only as far as the...
-
MATH302 Week 2 Test
- Other • 19 pages • 2023
- Available in package deal
-
- $35.99
- + learn more
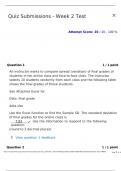
1. Question: An instructor wants to compare spread (variation) of final grades of students in her online class and face-to-face class. The instructor selects 10 students randomly from each class and the following table shows the final grades of those students. See Attached Excel for Data. 2. Question: The lengths (in kilometers) of rivers on the South Island of New Zealand that flow to the Tasman Sea are listed below. Find the variance. See Attached Excel for Data. Use the Excel function to fin...

$6.50 for your textbook summary multiplied by 100 fellow students... Do the math: that's a lot of money! Don't be a thief of your own wallet and start uploading yours now. Discover all about earning on Stuvia


