Econ 1002 week 3 exam - Study guides, Class notes & Summaries
Looking for the best study guides, study notes and summaries about Econ 1002 week 3 exam? On this page you'll find 13 study documents about Econ 1002 week 3 exam.
Page 2 out of 13 results
Sort by
-
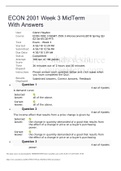
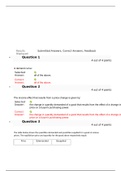
ECON 2001 Week 3 MidTerm With Answers ( LATEST UPDATE )
- Exam (elaborations) • 9 pages • 2021
- $12.49
- + learn more
User Glenn Hayden Course ECON-1002-3/MGMT-3503-3-Microeconomics2018 Spring Qtr 02/26-05/20-PT5 Test Exam - Week 3 Started 4/26/18 12:29 PM Submitted 4/26/18 12:56 PM Due Date 4/30/18 1:59 AM Status Completed Attempt Score Time Elapsed 100 out of 100 points 26 minutes out of 2 hours and 30 minutes Instructions Please answer each question below and click Submit when you have completed the Quiz. Results Displayed Submitted Answers, Correct Answers, Feedback A dem...
-
ECON 1002 Exam – MGMT 3503 Microeconomics WITH CORRECT Answers
- Exam (elaborations) • 9 pages • 2021
- $13.49
- + learn more
ECON 1002 Final Exam – MGMT 3503 Microeconomics with Answers ECON 1002 Final Exam – MGMT 3503 – Microeconomics Exam - Week 3 (92 out of 100 points ) 1. A demand curve: 2. The income effect that results from a price change is given by: 3. The table below shows the quantities demanded and quantities supplied for a good at various prices. The equilibrium price and quantity for the good above respectively equal: 4. When price is below the market equilibrium price: 5. The eco...

-
ECON 1002 l Exam – MGMT 3503 Microeconomics with Answers(LATEST DOCUMENT)
- Exam (elaborations) • 9 pages • 2021
- $10.39
- + learn more
ECON 1002 Final Exam – MGMT 3503 Microeconomics with Answers ECON 1002 Final Exam – MGMT 3503 – Microeconomics Exam - Week 3 (92 out of 100 points ) 1. A demand curve: 2. The income effect that results from a price change is given by: 3. The table below shows the quantities demanded and quantities supplied for a good at various prices. The equilibrium price and quantity for the good above respectively equal: 4. When price is below the market equilibrium price: 5. The eco...

Want to regain your expenses?

