Math 533 - Study guides, Class notes & Summaries
Looking for the best study guides, study notes and summaries about Math 533? On this page you'll find 137 study documents about Math 533.
Page 2 out of 137 results
Sort by
-
Keller MATH 533 Course Project Part B, Hypothesis Testing
- Exam (elaborations) • 13 pages • 2023
-
 STUDYCENTER2024
- $8.49
- + learn more
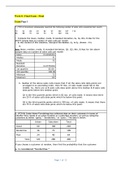
Keller MATH 533 Course Project Part B, Hypothesis Testing. Keller MATH 533 Course Project Part B, Hypothesis TestingRequirement A: The average (mean) sales per week exceeds 41.5 per salesperson. Key Statistics as computed by Minitab Variable N N* Mean SE Mean StDev Minimum Q1 Median Q3 SALES 100 0 42.340 0.417 4.171 32.000 39.250 42.000 45.000 N for Variable Maximum Range IQR Mode Mode SALES 52.000 20.000 5.750 44 12 Step 1 Hypotheses Ho: μ = 41.5 Ha: μ > 41.5 Step 2 Level of Sig...
-
Math-533 Applied Managerial Statistics..
- Exam (elaborations) • 13 pages • 2023
-
 experttutor01
- $19.79
- + learn more
Math-533 Applied Managerial Statistics..Math-533 Applied Managerial Statistics..Math-533 Applied Managerial Statistics..Math-533 Applied Managerial Statistics..

-
MATH 533 Course Project Part C Regression Model Keller 2023
- Exam (elaborations) • 18 pages • 2023
-
STUDYCENTER2024
- $12.49
- + learn more
MATH 533 Course Project Part C Regression Model Keller 2023. The correlation coefficient between sales and calls is calculated as 0.871. This positive correlation coefficient tells us that as the number of calls increase so does the number of sales. Correlation: Sales, Calls (Appendix III) Minitab Result Pearson correlation of Sales and Calls = 0.871 P-Value = 0.000 4. Minitab Result: (See above Fitted Line Plot for below result) S = 2.05708 R-Sq = 75.9% R-Sq(adj) = 75.7% The coefficien...

-
MATH 533 Course Project Part C Regression Model Keller 2023
- Exam (elaborations) • 18 pages • 2023
-
 STUDYLAB2023
- $10.49
- + learn more
MATH 533 Course Project Part C Regression Model Keller 2023. The regression analysis is telling us that for each additional call sales will go up by 0.202. Minitab Result Regression Analysis: SALES versus CALLS (Appendix II) The regression equation is SALES = 9.64 + 0.202 CALLS Math 3 3. The correlation coefficient between sales and calls is calculated as 0.871. This positive correlation coefficient tells us that as the number of calls increase so does the number of sales. Correlation: ...
-
MATH 533 Week 8 Final Exam(100% CORRECT Solution) | Already graded A+
- Exam (elaborations) • 13 pages • 2023
-
 Lectjoe
- $25.49
- + learn more
MATH 533 Week 8 Final Exam(100% CORRECT Solution) | Already graded A+

As you read this, a fellow student has made another $4.70


-
MATH 533 Course Project Part B, Hypothesis Testing
- Exam (elaborations) • 13 pages • 2023
-
 SOLUTIONS2024
- $10.49
- + learn more
MATH 533 Course Project Part B, Hypothesis Testing. Hypotheses testing involves the testing of the null hypothesis and the alternative hypothesis. When testing the hypothesis either the null hypothesis or the alternative hypotheses is rejected. The value to a company knowing to accept or reject a hypothesis will aid in the decision making process. Information derived from hypothesis testing can aid in more timely decision. Requirement A: The average (mean) sales per week exceeds 41.5 per sa...

-
MATH 533 Week 7 Course Project Part C Regression and Correlation Analysis
- Exam (elaborations) • 15 pages • 2023
-
STUDYCENTER2024
- $9.49
- + learn more
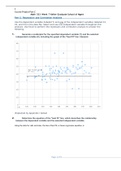
MATH 533 Week 7 Course Project Part C Regression and Correlation Analysis. It is evident with the help of scatter graph trend line that there is positive relationship between Sales and calls. If number of calls increases the sales also increase and vice versa. Ans. 2 With help of Minitab, the regression equation is mentioned below as: Minitab Result Regression Analysis: Sales versus Calls The regression equation is Sales = 9.638 + 0.2018 Calls Ans. 3 Math 3 The correlation coefficient ...
-
MATH 533 Course Project Part C Regression Model Keller 2023
- Exam (elaborations) • 18 pages • 2023
-
SOLUTIONS2024
- $10.49
- + learn more
MATH 533 Course Project Part C Regression Model Keller 2023. The correlation coefficient between sales and calls is calculated as 0.871. This positive correlation coefficient tells us that as the number of calls increase so does the number of sales. Correlation: Sales, Calls (Appendix III) Minitab Result Pearson correlation of Sales and Calls = 0.871 P-Value = 0.000 4. Minitab Result: (See above Fitted Line Plot for below result) S = 2.05708 R-Sq = 75.9% R-Sq(adj) = 75.7% The coefficien...

-
Keller MATH 533 Course Project Part B, Hypothesis Testing
- Exam (elaborations) • 13 pages • 2023
-
STUDYLAB2023
- $10.49
- + learn more
Keller MATH 533 Course Project Part B, Hypothesis Testing. Hypotheses testing involves the testing of the null hypothesis and the alternative hypothesis. When testing the hypothesis either the null hypothesis or the alternative hypotheses is rejected. The value to a company knowing to accept or reject a hypothesis will aid in the decision making process. Information derived from hypothesis testing can aid in more timely decision. Requirement A: The average (mean) sales per week exceeds 41.5...
-
Math 533 Week 7 Keller Graduate School of Mgmt
- Exam (elaborations) • 9 pages • 2023
-
Lectjoe
- $23.49
- + learn more
Math 533 Week 7 Keller Graduate School of Mgmt
