Math302 week 2 Study guides, Class notes & Summaries
Looking for the best study guides, study notes and summaries about Math302 week 2? On this page you'll find 52 study documents about Math302 week 2.
Page 2 out of 52 results
Sort by
-
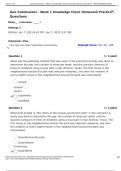
MATH302 Week 2 Knowledge Check Homework Practice Questions
- Exam (elaborations) • 10 pages • 2023
- $22.49
- + learn more
1. Question: What was the sampling method that was used in the scenario? A study was done to determine the age, the number of times per week, and the duration (amount of time) of residents using a local park in San Antonio, Texas. The first house in the neighborhood around the park was selected randomly, and then the resident of every eighth house in the neighborhood around the park was interviewed. 2. Question: What kind of data is "the colors of the houses around the park" in the scenario? ...

-
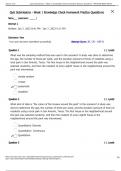
MATH302 Week 2 Knowledge Check Homework Practice Questions
- Exam (elaborations) • 10 pages • 2023
- $29.49
- + learn more
1. Question: What was the sampling method that was used in the scenario? A study was done to determine the age, the number of times per week, and the duration (amount of time) of residents using a local park in San Antonio, Texas. The first house in the neighborhood around the park was selected randomly, and then the resident of every eighth house in the neighborhood around the park was interviewed. 2. Question: What kind of data is "the colors of the houses around the park" in the scenario? ...
-
MATH302 Week 2 Knowledge Check Homework Practice Questions
- Exam (elaborations) • 8 pages • 2023
- $34.99
- + learn more
1. Question: What was the sampling method that was used in the scenario? A study was done to determine the age, the number of times per week, and the duration (amount of time) of residents using a local park in San Antonio, Texas. The first house in the neighborhood around the park was selected randomly, and then the resident of every eighth house in the neighborhood around the park was interviewed. 2. Question: What kind of data is "the colors of the houses around the park" in the scenario? ...

-
MATH302 Week 2 Knowledge Check Homework Practice Questions
- Exam (elaborations) • 10 pages • 2023
- $24.49
- + learn more
MATH302 Week 2 Knowledge Check Homework Practice Questions

-
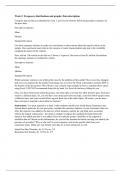
MATH302 Week 2 Discussion; Frequency distributions and graphs; Data description
- Other • 2 pages • 2023
- $18.48
- + learn more
Week 2: Frequency distributions and graphs; Data description Using the data set that you identified in week 1, use Excel to find the following descriptive statistics for the price data. Descriptive statistics: Mean Median Standard Deviation Use these summary statistics to make two conclusions or observations about the typical vehicle in the sample. One conclusion must relate to the measure of center (mean/median) and one to the variability (standard deviation) of the vehicles. Next,...

And that's how you make extra money


-
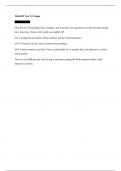
MATH302 Week 2 Test 2 Critique
- Other • 1 pages • 2023
- $20.99
- + learn more
MATH302 Week 2 Test 2 Critique

-
MATH302 Week 2 Test 2 Critique
- Other • 1 pages • 2023
- $20.99
- + learn more
MATH302 Week 2 Test 2 Critique
-
MATH302 Week 2 Test 2 Critique
- Exam (elaborations) • 1 pages • 2023
- $34.99
- + learn more
1. Question: An instructor wants to compare spread (variation) of final grades of students in her online class and face-to-face class. The instructor selects 10 students randomly from each class and the following table shows the final grades of those students. See Attached Excel for Data. 2. Question: The lengths (in kilometers) of rivers on the South Island of New Zealand that flow to the Tasman Sea are listed below. Find the variance. See Attached Excel for Data. Use the Excel function to fin...

-
MATH302 Week 2 Discussion; Frequency distributions and graphs; Data description.docx
- Other • 2 pages • 2023
- $18.48
- + learn more
Week 2: Frequency distributions and graphs; Data description Using the data set that you identified in week 1, use Excel to find the following descriptive statistics for the price data. Descriptive statistics: Mean Median Standard Deviation Use these summary statistics to make two conclusions or observations about the typical vehicle in the sample. One conclusion must relate to the measure of center (mean/median) and one to the variability (standard deviation) of the vehicles. Next,...
-
MATH302 Week 2 Discussion Frequency distributions and graphs Data description APU
- Other • 2 pages • 2024
- $14.99
- + learn more
MATH302 Week 2 Discussion Frequency distributions and graphs Data description APU
