Pie charts - Study guides, Class notes & Summaries
Looking for the best study guides, study notes and summaries about Pie charts? On this page you'll find 680 study documents about Pie charts.
Page 2 out of 680 results
Sort by
-
PL-300 Exam Questions and Answers Already Passed
- Exam (elaborations) • 199 pages • 2024
- Available in package deal
-
 BrilliantScores
-
- $12.99
- + learn more
PL-300 Exam Questions and Answers Already Passed How can you apply conditional formatting in Power BI? Conditional formatting in Power BI allows you to change the appearance of visuals based on specific conditions or values in the data. How can you embed a Power BI report into a website or application? Reports can be embedded into websites or applications by using Power BI's embedding APIs or generating an embed code from the Power BI Service. What are Power BI templates? Pow...
-
MISY 5325 Excel Midterm Ultimate Review with Complete Solutions
- Exam (elaborations) • 180 pages • 2024
- Available in package deal
-
 BrilliantScores
-
- $12.99
- + learn more
MISY 5325 Excel Midterm Ultimate Review with Complete Solutions Pressing the Ctrl key is required to select cells or ranges of cells that are not adjacent. To relocate a chart to another worksheet, users should employ the function **move chart**. If entered correctly, the functions SUMIF and DSUM will produce the same result. Which cell reference remains unchanged when formulas are copied and pasted into other cells? $A$1 (Absolute Reference) Which statement regarding the Ta...
-
Ali Bagheri MSIS 3223 Exam 1 Questions With 100% Correct Answers.
- Exam (elaborations) • 20 pages • 2024
- Available in package deal
-
 ACADEMICMATERIALS
-
- $7.99
- + learn more
•Common mathematical operators are used - -addition (+) -subtraction (-) -multiplication (*) -division (/) -exponentiation (^) Absolute references - $A$2, $C5, D$10 Advanced Filter - provides a way of explicitly defining criteria by which to filter a database. •First, copy the headers from the database to an open location in the worksheet. Under the headers, specify the criteria that you want to use to filter the data. -Multiple criteria in the same row are logically joined by "and...

-
Nursing Informatics Certification Exam, ANCC Informatics, ANCC Nursing Informatics Certification Review 629 Questions with Answers,100% CORRECT
- Exam (elaborations) • 110 pages • 2024
-
 paulhans
-
- $15.99
- 1x sold
- + learn more
Nursing Informatics Certification Exam, ANCC Informatics, ANCC Nursing Informatics Certification Review 629 Questions with Answers Meta structure of NI - CORRECT ANSWER The ability of the nurse to utilize data, information, and knowledge to make wise clinical decisions. Definition of Nursing Informatics - CORRECT ANSWER A speciality that integrates nursing science with multiple information and analytical sciences to identify, define, manage and communicate data, information, knowledge and ...
-
OMIS 472 exam 2 Question and answers already passed
- Exam (elaborations) • 12 pages • 2024
- Available in package deal
-
 Academia199
-
- $13.49
- + learn more
OMIS 472 exam 2 Question and answers already passed OMIS 472 exam 2 pie charts are most effective at: A. none of the above B. illustrating how data are changing over a period of time C. comparing purchases by vendor D. highlighting proportionate relationships among variables E. displaying production by product line - correct answer highlighting proportionate relationships among variables radar charts enable us to: A. track things like boats and airplanes which are in geographical ...
-
MISY 5325 Excel Midterm Ultimate Review Questions And Answers With Verified Solutions
- Exam (elaborations) • 123 pages • 2024
- Available in package deal
-
 PatrickKaylian
-
- $7.99
- + learn more
(Excel) TRUE/FALSE: To add a pie chart, first select the data to be charted and then tap or click the Insert Pie or Doughnut Chart button (INSERT tab | Charts group). - TRUE (Excel) TRUE/FALSE: To use the AutoCalculate area, select the range of cells containing the numbers for a calculation you want to verify and then press and hold or double-click the AutoCalculate area to display the Customize Status Bar shortcut menu. - FALSE (Excel) TRUE/FALSE: The Microsoft Office Specialist (MOS) p...
-
2024_AQA-GCSE Statistics Foundation Tier Paper 2 (Merged Question Paper and Marking Scheme) Monday 17 June 2024
- Exam (elaborations) • 59 pages • 2024
-
 Cate001
-
- $7.99
- + learn more
2024_AQA-GCSE Statistics Foundation Tier Paper 2 (Merged Question Paper and Marking Scheme) Monday 17 June 2024 Monday 17 June 2024 Afternoon Time allowed: 1 hour 45 minutes Materials For this paper you must have: • a calculator • mathematical instruments. Instructions • Use black ink or black ball-point pen. Draw diagrams in pencil. • Fill in the boxes at the top of this page. • Answer all questions. • You must answer the questions in the spaces ...
-
NAHQ Practice CPHQ | Questions with 100% Correct Answers | Verified | Latest Update 2024
- Exam (elaborations) • 46 pages • 2024
- Available in package deal
-
 ClassHero
-
- $14.49
- + learn more
1- In evaluating "long waiting times," a healthcare quality professional best demonstrates components related to staffing, methods, measures, materials, and equipment utilizing A. a run chart. B. a histogram. C. a pie chart. D. an Ishikawa diagram. - EXPLANATIONS: A. Run charts are used to track data over time. B. Histograms and bar charts are used to show distribution. C. Pie charts are used to compare parts of a whole. D. An Ishikawa (cause and effect) diagram helps to analyze p...
-
SAR MIS112 EXAM QUESTIONS WITH ALL CORRECT ANSWERS
- Exam (elaborations) • 17 pages • 2024
-
 Scholarsstudyguide
-
- $12.49
- + learn more
SAR MIS112 EXAM QUESTIONS WITH ALL CORRECT ANSWERS Which of the following is an object that contains the actual data in the chart? Plot area Pie area Bar area Column are - Answer-Plot area Fill in the blank: Every chart type has a set of ____ that you can choose from (with settings for chart elements such as a title, data labels, axes, and so on). Shapes Categories Layouts Attributes - Answer-Layouts Examine the attached workbook. If you want to remove chart label...
-
Statistics Portage CNSL 503 Exam 2 Questions And Answers Latest Top Score.
- Exam (elaborations) • 7 pages • 2024
-
 techgrades
-
- $10.49
- + learn more
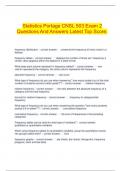
Statistics Portage CNSL 503 Exam 2 Questions And Answers Latest Top Score. frequency distribution - correct answer. presents the frequency of every value in a dataset frequency tables - correct answer. displays the number of times (ex: frequency) a certain value appears within the dataset in a table format What does each column represent in frequency tables? - correct answer. one column represents the category, the other column represents the frequency absol...

That summary you just bought made someone very happy. Also get paid weekly? Sell your study resources on Stuvia! Discover all about earning on Stuvia


