Box and whisker plot - Study guides, Class notes & Summaries
Looking for the best study guides, study notes and summaries about Box and whisker plot? On this page you'll find 222 study documents about Box and whisker plot.
Page 3 out of 222 results
Sort by

-
AP Statistics 1st Semester Final Exam Review Questions With Complete Solutions
- Exam (elaborations) • 6 pages • 2023
- Available in package deal
-
- $10.99
- + learn more
Name 3 categorical (qualitative) variables. correct answer: Favorite color/favorite candy/brand of car. Name 3 discrete quantitative variables. correct answer: How many shoes/how many siblings/how many pets. Name 3 continuous quantitative variables. correct answer: How long it takes to open a water bottle/amount of water draining in a tub/amount of rainfall in December. List the different graphical methods that can be used for categorical (qualitative) data. correct answer: Bar grap...
-
GACE Middle Grades Science 014 Exam Questions And Answers (Updated And Verified)
- Exam (elaborations) • 18 pages • 2024
- Available in package deal
-
- $12.49
- + learn more
GACE Middle Grades Science 014 Exam Questions And Answers (Updated And Verified) Scientific method - answerobservation question hypothesis experiment analyze & conclusion hypothesis - answera possible explanation, that can be tested, for a set of observations (can be changed or modified) theory - answeralso referred to as a model, describes and explains why phenomena occur (can be changed or modified) law - answeralso referred to as a principle, is a statement summarizing conditions ...
-
Saxon Math Test Exam Questions Correctly Answers 2024 Update
- Exam (elaborations) • 14 pages • 2024
-
- $12.89
- + learn more
Saxon Math Test Exam Questions Correctly Answers 2024 Update The distance from the graph of a number to the number 0 on a number line. - Answer -absolute value An angle whose measure is between 0 degrees and 90 degrees. - Answer -acute angle A triangle whose largest angle measures between 0 degrees and 90 degrees. - Answer -acute triangle One of two or more numbers that are added to find a sum. - Answer -addend The number 0. See also Identity Property of Addition. - Answer -additi...
-
Official ILTS Math Already Graded A+
- Exam (elaborations) • 15 pages • 2024
- Available in package deal
-
- $9.49
- + learn more
Official ILTS Math Already Graded A+ Skip Counting Counting by a number, like 3's Can be used to teach students the concept of multiplication Inverse Operation of Multiplication Division 12/3 = 4 implies that 12 = 4 x3 benchmark fraction Fractions that are commonly used for estimation. Example: 0, 1/2, and 1. Helps students gain an understanding of the magnitude of other fractions Equilateral Triangle A triangle with three congruent sides Angles will always be 60 degrees Is...
-
DFM 101-Data Science Principles exam questions with 100% correct answers
- Exam (elaborations) • 4 pages • 2024
-
- $14.49
- + learn more
What field of study attempts to extract knowledge and statistically accurate information from various forms of data Data Science Data Scientists lean heavily on what method Scientific method AKA "advanced statistics" What are the multiple disciplines considered essential for applying Data Science Data visualization, statistics, programming, machine learning, and data modeling What do data scientists do Study and pull meaningful info from pools of data, analysis ...
-
Test Bank For Business Statistics For Contemporary Decision Making 8th Edition By Black
- Exam (elaborations) • 626 pages • 2023
-
- $30.09
- + learn more
File: ch03, Chapter 3: Descriptive Statistics True/False 1. Statistical measures used to yield information about the center or the middle parts of a group of numbers are called the measures of central tendency. Ans: True Response: See section 3.1 Measures of Central Tendency: Ungrouped Data Difficulty: Easy Learning Objective: 3.1: Apply various measures of central tendency—including the mean, median, and mode—to a set of ungrouped data. 2. The most appropriate measure ...
-
NSG-522 Midterm Real exam questions with correct answers |100% guaranteed
- Exam (elaborations) • 10 pages • 2024
-
- $9.99
- + learn more
NSG-522 Midterm Real exam questions with correct answers |100% guaranteed 27 a variable was coded as disease present, disease not present, or disease status unknown. When performing the descriptive statistics, which of the following should be used? SELECT ALL THAT APPLY Percentages Frequencies 28 A student conducting a quality improvement project on a unit in the university hospital where the student is enrolled. Since the project is required by the university, the student does not ne...
-
Test Bank For Business Statistics In Practice 8th Edition By Bowerman
- Exam (elaborations) • 871 pages • 2023
-
- $30.09
- + learn more
Chapter 03 Test Bank - Static KEY 1. The median is the measure of central tendency that divides a population or sample into four equal parts. FALSE The median divides a population into two equal parts. AACSB: Reflective Thinking Blooms: Remember Difficulty: 1 Easy Learning Objective: 03-01 Compute and interpret the mean, median, and mode. Topic: Describing Central Tendency 2. The population mean is the average of the population measurements. TRUE AACSB: Reflective Thinking B...
-
Tableau Desktop Specialist Certification Test | All Questions & Answers (100% Correct)
- Exam (elaborations) • 14 pages • 2023
- Available in package deal
-
- $11.99
- + learn more
Tableau Desktop Specialist Certification Test | All Questions & Answers (100% Correct) Tableau Desktop Specialist Certification Test | All Questions & Answers (100% Correct) How many rows of data appear in Tableau preview? - ANSWER - 1000 What is the data source page? - ANSWER - This is where you connect to a data source and see sheets from the data source (on left , shown) to bring into the join area. Drag or double click sheets to bring onto the canvas. What is a mark? - ANSWER - The...
-
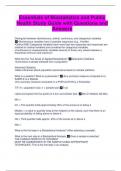
Essentials of Biostatistics and Public Health Study Guide with Questions and Answers
- Exam (elaborations) • 8 pages • 2024
- Available in package deal
-
- $7.99
- + learn more
Distinguish between dichotomous, ordinal, continuous, and categorical variables. •Dichotomous variables have 2 possible responses (e.g., Yes/No) •Ordinal AND Categorical variables have more than two responses and responses are ordered for ordinal variables and unordered for categorical variables. •Continuous (or measurement) variables assume in theory any values between a theoretical minimum and maximum What Are the Two Areas of Applied Biostatistics? Descriptive Statistics -Summ...

Study stress? For sellers on Stuvia, these are actually golden times. KA-CHING! Earn from your study resources too and start uploading now. Discover all about earning on Stuvia


