Data dashboards - Study guides, Class notes & Summaries
Looking for the best study guides, study notes and summaries about Data dashboards? On this page you'll find 1541 study documents about Data dashboards.
Page 3 out of 1.541 results
Sort by
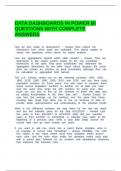
DATA DASHBOARDS IN POWER BI QUESTIONS WITH COMPLETE ANSWERS.
-
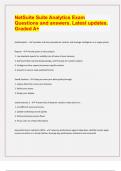
NetSuite Suite Analytics Exam Questions and answers. Latest updates. Graded A+
- Exam (elaborations) • 36 pages • 2023
- Available in package deal
-
PassPoint02
-
- $11.49
- 1x sold
- + learn more
NetSuite Suite Analytics Exam Questions and answers. Latest updates. Graded A+ SuiteAnalytics - -provides real-time operational, tactical, and strategic intelligence in a single system Reports - -Provide point in time analysis: 1. tap standard reports for visibility into all areas of your business 2. Add new fields, hierarchical groupings, and formulas for custom analysis 3. Configure ad-hoc reports to present specific metrics 4. present in easy-to-read, polished format Saved Sea...
-
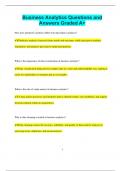
Business Analytics Questions and Answers Graded A+
- Exam (elaborations) • 31 pages • 2025
- Available in package deal
-
 BrilliantScores
-
- $10.49
- + learn more
Business Analytics Questions and Answers Graded A+ How does predictive analytics differ from descriptive analytics? Predictive analytics forecasts future trends and outcomes, while descriptive analytics summarizes and analyzes past data to understand patterns. What is the importance of data visualization in business analytics? Data visualization helps present complex data in a clear and understandable way, making it easier for stakeholders to interpret and act on insights. What i...
-
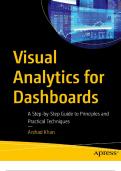
Visual Analytics for Dashboards A Step-by-Step Guide to Principles and Practical Techniques 2024 with complete solution;Chapter 1-11
- Exam (elaborations) • 191 pages • 2024
-
 Wiseman
-
- $30.49
- + learn more
Visual Analytics for Dashboards A Step-by-Step Guide to Principles and Practical Techniques 2024 with complete solution Table of Contents Chapter 1: Dashboards Business Intelligence Objective and Technologies Defining Business Intelligence Business Intelligence Tools Convergence of Disciplines Background Business Dashboard Predecessor Change in User Needs Major Changes Since the 1990s Dashboards Car Dashboard Business Dashboard Definition Objective Key Features Process Suppor...
-
Power BI Questions and Answers with Complete Solutions
- Exam (elaborations) • 26 pages • 2024
- Available in package deal
-
 BrilliantScores
-
- $9.99
- + learn more
Power BI Questions and Answers with Complete Solutions What is the primary function of Power BI? Power BI is used for data visualization and business intelligence, helping users create interactive reports and dashboards from various data sources. How can you import data into Power BI? You can import data into Power BI from multiple sources, including Excel files, SQL databases, web services, and other data connectors. What is a Power BI Dashboard? A Power BI dashboard is a sin...
-
COG 170 Practice Test Questions and Answers All Correct
- Exam (elaborations) • 23 pages • 2023
- Available in package deal
-
 Perfectscorer
-
- $11.99
- 1x sold
- + learn more
COG 170 Practice Test Questions and Answers All Correct Dashboard - ANSWER first thing users see when they log into EPIC. Centralize content from around Hyperspace. Report Listing Component - ANSWER in the left column of the dashboard. Personalization - ANSWER When an end user selects a source dashboard from the Analytics CAtalog, a personalized copy is created just for them. End user personalized copies of these source dashboards & components ar...
-
Solutions for Data Visualization, Exploring and Explaining with Data, 2nd Edition by Camm (All Chapters included)
- Exam (elaborations) • 426 pages • 2024
-
 mizhouubcca
-
- $29.49
- + learn more
Complete Solutions Manual for Data Visualization, Exploring and Explaining with Data, 2nd Edition by Jeffrey D. Camm, James J. Cochran, Michael J. Fry, Jeffrey W. Ohlmann ; ISBN13: 9780357929766....(Full Chapters included and organized in reverse order from Chapter 9 to 1)...1. Introduction. 2. Selecting a Chart Type. 3. Data Visualization and Design. 4. Purposeful Use of Color. 5. Visualizing Variability. 6. Exploring Data Visually. 7. Explaining Visually to Influence with Data. 8. Data ...
-
PL-300 Exam Questions and Answers Already Passed
- Exam (elaborations) • 199 pages • 2024
- Available in package deal
-
 BrilliantScores
-
- $12.99
- + learn more
PL-300 Exam Questions and Answers Already Passed How can you apply conditional formatting in Power BI? Conditional formatting in Power BI allows you to change the appearance of visuals based on specific conditions or values in the data. How can you embed a Power BI report into a website or application? Reports can be embedded into websites or applications by using Power BI's embedding APIs or generating an embed code from the Power BI Service. What are Power BI templates? Pow...
-
Power BI Questions and Answers Already Graded A
- Exam (elaborations) • 18 pages • 2024
- Available in package deal
-
 BrilliantScores
-
- $9.99
- + learn more
Power BI Questions and Answers Already Graded A Which of the following can be used to perform calculations across multiple tables in Power BI? A) Excel B) DAX measures C) Power Query Editor D) Report view B) DAX measures What does the "Power BI Service" allow users to do that Power BI Desktop does not? A) Create data models B) Share and collaborate on reports and dashboards C) Create new calculated columns D) Perform advanced data cleaning B) Share and collaborate on r...
-
Salesforce Business Analyst 2 Questions and Answers Already Passed
- Exam (elaborations) • 30 pages • 2025
- Available in package deal
-
 BrilliantScores
-
- $10.49
- + learn more
Salesforce Business Analyst 2 Questions and Answers Already Passed Which tool in Salesforce can a Business Analyst use to automate business processes? a) Visualforce Pages b) Process Builder c) Lightning App Builder d) Apex Triggers What is the purpose of conducting a gap analysis in Salesforce projects? a) To identify discrepancies between current systems and desired outcomes b) To collect user feedback after the implementation c) To write technical specifications for developers...

$6.50 for your textbook summary multiplied by 100 fellow students... Do the math: that's a lot of money! Don't be a thief of your own wallet and start uploading yours now. Discover all about earning on Stuvia

