Independent variab - Study guides, Class notes & Summaries
Looking for the best study guides, study notes and summaries about Independent variab? On this page you'll find 32 study documents about Independent variab.
Page 3 out of 32 results
Sort by
-
N6 Team Summary1-3 SPE 525 Module 3: N6-Team Discussion Summary 1 SPE 525 Summer 2021 Session A Part 1: Research Questions in Single Subject Research Designs 1. Demonstration: (Does it work) What relations exist between an independent variable
- Summary • 4 pages • 2021
- $7.49
- + learn more
N6 Team Summary1-3 SPE 525 Module 3: N6-Team Discussion Summary 1 SPE 525 Summer 2021 Session A Part 1: Research Questions in Single Subject Research Designs 1. Demonstration: (Does it work) What relations exist between an independent variable and a behavior. Little Johnny is usually aggressive when playing. Will giving little Johnny praise for playing nicely decrease his aggression. 2. Comparison: Does manding increase by using a manding board or Verbal Imitation? 3. Component:...
-
Wk6.extension.docx Week 6 Interpretation and Application of Public Health Data Week 6 Project Walden University RQ: Is there an association between Gender and Cancer? Dependent Variable: Cancer Independent Variable(s): Gender Null Hypothesis: The
- Summary • 4 pages • 2021
- $7.49
- + learn more
W Week 6 Interpretation and Application of Public Health Data Week 6 Project Walden University RQ: Is there an association between Gender and Cancer? Dependent Variable: Cancer Independent Variable(s): Gender Null Hypothesis: There is no relationship between Gender and Cancer. Alternate Hypothesis: There is an association between Gender and Cancer. Introduction The human body comprises cells (30 trillion), tissues, organs, and organ systems. The human cells grow old and die. New cell...

-
Week7Proj.docx Week 7 Interpretation and Application of Public Health Data Week 7 Project Walden University RQ: Is there an association between Cancer and Gender (Male= 0, Female = 1)? Dependent Variable: Cancer Independent Variable (s): Gender Nu
- Summary • 3 pages • 2021
- $7.49
- + learn more
Week7P Week 7 Interpretation and Application of Public Health Data Week 7 Project Walden University RQ: Is there an association between Cancer and Gender (Male= 0, Female = 1)? Dependent Variable: Cancer Independent Variable (s): Gender Null Hypothesis: There is no relationship between Gender and Cancer. Alternate Hypothesis: There is an association between Gender and Cancer. Methods Study Sample The study will be focused on 350 diagnosed Cancer patients between the years 2012 throug...
-
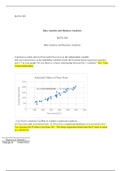
DATA Week 5.docx DATA 565 Data Analysis and Business Analytics DATA 565 Data Analysis and Business Analytics Construct a scatter plot in Excel with FloorArea as the independent variable and AssessmentValue as the dependent variable. Insert the bi
- Summary • 6 pages • 2021
- $7.49
- + learn more
DATA Week DATA 565 Data Analysis and Business Analytics DATA 565 Data Analysis and Business Analytics Construct a scatter plot in Excel with FloorArea as the independent variable and AssessmentValue as the dependent variable. Insert the bivariate linear regression equation and r^2 in your graph. Do you observe a linear relationship between the 2 variables? Yes. Very strong relationship. Use Excel s Analysis ToolPak to conduct a regression analysis of FloorArea a...
-
Statistics notes
- Summary • 2 pages • 2023
- $9.57
- + learn more
This is a collection of notes I took, summarizing reading material provided to me by my university. there are some highlighted points talking about figures or diagrams- please ignore those because the visuals weren't pasted into the document. instead, consider these notes as general definitions and explanations of key statistical terms. It isn't detailed or authentic- its just notes I took.

Want to regain your expenses?

-
• Treating Cost/Mile as the dependent variable, develop an estimated regression with Family-Sedan and Upscale-Sedan as the independent variables. Discuss your findings.
- Answers • 6 pages • 2020
- $3.39
- 4x sold
- + learn more
• Treating Cost/Mile as the dependent variable, develop an estimated regression with Family-Sedan and Upscale-Sedan as the independent variables. Discuss your findings. • Treating Value Score as the dependent variable, develop an estimated regression equation using Cost/Mile, Road-Test Score, Predicted Reliability, Family-Sedan, and Upscale-Sedan as the independent variables. • Delete any independent variables that are not significant from the estimated regression equation developed in par...
-
NRS 493 TOPIC 8 DQ 1(2022/2023) Based on how you will evaluate your EBP project, which independent and dependent variables do you need to collect? Why?
- Summary • 2 pages • 2020
- $7.49
- + learn more
NRS 493 TOPIC 8 DQ 1(2022/2023) Based on how you will evaluate your EBP project, which independent and dependent variables do you need to collect? Why?
-
Week 5 Assignment.docx PSY8501 Week 5 Data Analysis and Application Capella University PSY8501 Factorial experimental designs allow for researchers to study more than one independent variable within the same experiment (Goodwin, 2017). For the p
- Summary • 8 pages • 2021
- $7.49
- + learn more
Week 5 A PSY8501 Week 5 Data Analysis and Application Capella University PSY8501 Factorial experimental designs allow for researchers to study more than one independent variable within the same experiment (Goodwin, 2017). For the purpose of this assignment, using the Caffeine, Exercise and Heart Rate Dataset a two-way factorial ANOVA will be completed utilizing SPSS and analyzed. Data File Description The data file used for this assignment is the Caffeine, Exercise and Heart Rate D...
-
Compare independent variables
- Exam (elaborations) • 2 pages • 2021
- $7.99
- + learn more
Compare independent variables/Compare independent variables/Compare independent variables
-
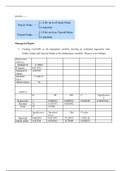
Week 7 Assignment 7.edited.docx2.docx Week 7 Assignment 7 Strayer University MAT 510 Business Statistics The following table shows the regression calculationwhen using the regression analysis. The dependent variable passed time and the independent
- Summary • 5 pages • 2021
- $5.49
- + learn more
Week 7 Assignment Week 7 Assignment 7 Strayer University MAT 510 Business Statistics The following table shows the regression calculationwhen using the regression analysis. The dependent variable passed time and the independent variable shows when time is old or new. Data provided below: Insurance Claim Approval Times Provided From Assignment Week Elapsed Time Process 1 31.7 0 2 27 0 3 33.8 0
