Stat 200 week 8 homework Study guides, Class notes & Summaries
Looking for the best study guides, study notes and summaries about Stat 200 week 8 homework? On this page you'll find 63 study documents about Stat 200 week 8 homework.
Page 3 out of 63 results
Sort by
-
HESI RN EXITEXAM COMPREHENS IVE V2-2021 ACTUAL EXAM
- Exam (elaborations) • 28 pages • 2022
- $16.99
- + learn more
[COMPANY NAME] [Company address] HESI RN EXITEXAM COMPREHENS IVE V2-2021 ACTUAL EXAM HESI RN EXIT EXAM COMPREHENS IVE V2-2021 ACTUAL EXAM 1. The school nurse is preparing a presentation for an elementary school teacher to inform them about when a child should be referred to the school clinic for further follow-up. The teachers should be instructed to report which situations to the school nurse? (Select all that apply) a. Refusesto complete written homework assignments b. Thirst a...
-
STAT 200 WEEK 8 HOMEWORK – 9.6/10 – 96%
- Exam (elaborations) • 14 pages • 2021
- $12.00
- + learn more
STAT 200 WEEK 8 HOMEWORK – 9.6/10 – 96% Question 1 (0.5 points) A team of cognitive psychologists studying the effects of sleep deprivation on short-term memory decay had eight participants stay in a sleep lab for two days. Four participants were randomly assigned to a condition in which they were not permitted to sleep during that period, while the other four participants were allowed to sleep when they wanted to. At the end of the two days, the participants completed a short-term memor...

-
STAT 200 Week 4 Homework Problems Solutions, University of Maryland University College (UMUC)
- Exam (elaborations) • 5 pages • 2022
- $15.99
- + learn more
STAT 200 Week 4 Homework Problems 6.1.2 1.) The commuter trains on the Red Line for the Regional Transit Authority (RTA) in Cleveland, OH, have a waiting time during peak rush hour periods of eight minutes ("2012 annual report," 2012). a.) State the random variable. x=waiting time during peak hours b.) Find the height of this uniform distribution. 1/(8-0)=0.125 c.) Find the probability of waiting between four and five minutes. P(4<x<5)=(5-4)*0.125=0.125 d.) Find the probabilit...
-
MATH 225N WEEK 8 QUESTIONS WITH ANSWERS 100% CORRECT
- Exam (elaborations) • 54 pages • 2023
- $13.49
- + learn more
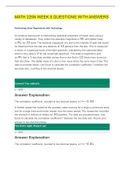
MATH 225N WEEK 8 QUESTIONS WITH ANSWERS Performing Linear Regressions with Technology An amateur astronomer is researching statistical properties of known stars using a variety of databases. They collect the absolute magnitude or MV and stellar mass or M⊙ for 30 stars. The absolute magnitude of a star is the intensity of light that would be observed from the star at a distance of 10 parsecs from the star. This is measured in terms of a particular band of the light spectrum, indicated ...

-
HESI RN EXIT EXAM COMPREHENS IVE V2-2021 ACTUAL EXAM
- Exam (elaborations) • 41 pages • 2023
- $14.29
- + learn more
HESI RN EXIT EXAM COMPREHENS IVE V2-2021 ACTUAL EXAM 1. The school nurse is preparing a presentation for an elementary school teacher to inform them about when a child should be referred to the school clinic for further follow-up. The teachers should be instructed to report which situations to the school nurse? (Select all that apply) a. Refuses to complete written homework assignments b. Thirst and frequent requests for bathroom breaks c. Bruises on both knees after the weekend 2....

Too much month left at the end of the money?

-
STAT 200 STAT200 WEEK 7 HOMEWORK with accurate SOLUTION (UMUC)
- Exam (elaborations) • 8 pages • 2022
- $11.00
- + learn more
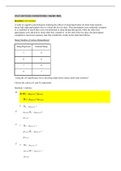
STAT 200 STAT200 WEEK 7 HOMEWORK with accurate SOLUTION (UMUC) STAT 200 STAT200 WEEK 7 HOMEWORK SOLUTION (UMUC) Anquanette Sterling STAT Week 7 Homework #1) 2 Points 2. The formula for a regression equation is Y’ = 2X + 9. a. What would be the predicted score for a person scoring 6 on X? Y = 2(6) + 9 = 12+9 = 21 b. If someone’s predicted score was 14, what was this person’s score on X? 14 = 2X + 9 -9 -9 5 = 2X 2.5 = X #2) 2 Points 6. For the X,Y data below ...
-
STAT 200 Week 3 Homework Problems
- Exam (elaborations) • 6 pages • 2022
- $7.99
- + learn more
STAT 200 Week 3 Homework Problems. A project conducted by the Australian Federal Office of Road Safety asked people many questions about their cars. One question was the reason that a person chooses a given car, and that data is in table #4.1.4 ("Car preferences," 2013). Table #4.1.4: Reason for Choosing a Car Safety Reliability Cost Performance Comfort Looks 84 62 46 34 47 27 Find the probability a person chooses a car for each of the given reasons. Total: 84+62+46+34+47+27=300 Safety...
-
University of Maryland - STAT 200; Week 7 Homework Problems, Already Graded A.
- Exam (elaborations) • 8 pages • 2021
- $10.99
- + learn more
University of Maryland - STAT 200 Week 7 Homework Problems. THE TABLE FOR EACH QUESTION PLUST THE FULL QUESTIONS CAN BE FOUND IN THE ATTATCHMENT!!!!!!!! 1 table #10.1.6 contains the value of the house and the amount of rental income in a year that the house brings in ("Capital and rental," 2013). Create a scatter plot and find a regression equation between house value and rental income. Then use the regression equation to find the rental income a house worth $230,000 and for a house worth $400...
![STAT 200 WEEK 8 HOMEWORK [SOLVED > GRADE A]](/docpics/6138b84eb045c_1286907.jpg)
-
STAT 200 WEEK 8 HOMEWORK [SOLVED > GRADE A]
- Exam (elaborations) • 14 pages • 2021
- $9.99
- + learn more
Question 1 (0.5 points) A team of cognitive psychologists studying the effects of sleep deprivation on short-term memory decay had eight participants stay in a sleep lab for two days. Four participants were randomly assigned to a condition in which they were not permitted to sleep during that period, while the other four participants were allowed to sleep when they wanted to. At the end of the two days, the participants completed a short-term memory task that yielded the results in the tabl...
-
STAT 200 Week 4 Homework Problems - STAT200 Week 4: Introduction To Statistics Quiz
- Exam (elaborations) • 5 pages • 2021
- $15.20
- + learn more
STAT 200 Week 4 Homework Problems 6.1.2 ⦁ The commuter trains on the Red Line for the Regional Transit Authority (RTA) in Cleveland, OH, have a waiting time during peak rush hour periods of eight minutes ("2012 annual report," 2012). ⦁ State the random variable. X=The waiting time of the trains on the Red Line ⦁ Find the height of this uniform distribution. F(x)= 1/8-0 = 0.125 ⦁ Find the probability of waiting between four and five minutes. P(4<X<5)= (5-4)*0.125 = 0.125...
