Line graphs - Study guides, Class notes & Summaries
Looking for the best study guides, study notes and summaries about Line graphs? On this page you'll find 1470 study documents about Line graphs.
Page 4 out of 1.470 results
Sort by
-
STAT 250 GMU EXAM 1 QUESTIONS AND ANSWERS 100% PASS
- Exam (elaborations) • 14 pages • 2024
-
- $9.99
- + learn more
STAT 250 GMU EXAM 1 QUESTIONS AND ANSWERS 100% PASS 2 main components of categorical distribution -Mode (typical/ most frequent outcome) -Variability (or diversity in outcomes) Appropriate graphs for Categorical data -Pie chart -Bar graph Appropriate graphs for Numerical data -Dotplot -Histogram -Stemplot Appropriate measures of center & spread for SKEWED distributions Center- Median Spread- Interquartile Range (The median is not affected by outliers and its value doess not ...

-
MCB 150 Final Exam Study Guide | 100% Correct | Verified | Latest Update 2024 | 25 Pages
- Exam (elaborations) • 25 pages • 2023
-
- $17.49
- + learn more
What are the bonds and their strengths in order? - Covalent Ionic Hydrogen Van der Waal (LDF) Line Graphs are - best for displaying continuous quantitative data Scatter Plots are - for identifying correlations between two variables Bar Graphs are - for displaying discrete categories of data Histograms are - are for displaying contiguous data grouped into ranges of value List the following in order from smallest to largest ecosystem cells molecule/macromolecule organs population a...
-
Princeton Review Digital SAT Premium Prep, 2024: 4 Practice Tests + Online Flashcards + Review & Tools (2024) (College Test Preparation) 100% Guaranteed Success
- Exam (elaborations) • 901 pages • 2024
-
- $25.49
- + learn more
Princeton Review Digital SAT Premium Prep, 2024: 4 Practice Tests + Online Flashcards + Review & Tools (2024) (College Test Preparation) 100% Guaranteed Success THE SAT HAS GONE DIGITAL! Ace the exam with The Princeton Review's new guide, packed with subject reviews, techniques specific to the digital format, and 4 full-length practice tests (1 in the book and 3 online, to give you realistic digital practice for the all-digital exam). This book is for the Digital SAT, which debuts in the...

-
Test Banks For Essential Calculus 2nd Edition by James Stewart, 9781133112297, Chapter 1-13 Complete Guide
- Exam (elaborations) • 298 pages • 2023
-
- $29.94
- 1x sold
- + learn more
Essential Calculus 2nd Edition 2297 0875 0, 3, 4, 0, 2467, 3011, 9067, 6609 1: Functions and Limits 1.1: Functions and Their Representations 1.2: A Catalog of Essential Functions 1.3: The Limit of a Function 1.4: Calculating Limits 1.5: Continuity 1.6: Limits Involving Infinity 2: Derivatives 2.1: Derivatives and Rates of Change 2.2: The Derivative as a Function 2.3: Basic Differentiation Formulas 2.4: The Product and Quotient Rules 2.5: The Chain ...
-
Appian Analyst and Business Section question with correct answers
- Exam (elaborations) • 44 pages • 2023
- Available in package deal
-
- $14.99
- + learn more
user interfaces CORRECT ANSWER There are 3 types of ___ ___: - Tempo : end user experience and has 5 tabs - Sites: allow users to focus on a limited set of activities - Embedded: Reports display CORRECT ANSWER data by: - Grids - allows paging and filtering - Graphs o Pie o Bar o Line Reports aggregate CORRECT ANSWER data from: - Records - Databases - Process Analytics - Third Party Systems Acceptance Criteria CORRECT ANSWER Details and requirements that indicate the scope o...
-
Solution Manual for Statistics for Nursing Research A Workbook for Evidence-Based Practice 3rd Edition Susan Grove Daisha
- Exam (elaborations) • 75 pages • 2024
-
- $17.99
- + learn more
Part 1: Understanding Statistical Methods 1. Identifying Levels of Measurement: Nominal, Ordinal, Interval, and Ratio 2. Identifying Probability and Nonprobability Sampling Methods in Studies 3. Understanding the Sampling Section of a Research Report: Population, Sampling Criteria, Sample Size, Refusal Rate, and Attrition Rate 4. Understanding Reliability of Measurement Methods 5. Understanding Validity of Measurement Methods 6. Understanding Frequencies and Percentages 7. Interpreting Line Gra...
-
Appian Analyst and Business Section Exam Questions and Answers Already Graded A+
- Exam (elaborations) • 17 pages • 2023
- Available in package deal
-
- $10.49
- + learn more
There are 3 types of user interfaces: - ANSWER - Tempo : end user experience and has 5 tabs - Sites: allow users to focus on a limited set of activities - Embedded: Reports can display data by: - ANSWER - Grids - allows paging and filtering - Graphs o Pie o Bar o Line Reports aggregate data from: - ANSWER - Records - Databases - Process Analytics - Third Party Systems Acceptance Criteria - ANSWER Details that indicate the scope of a user story and help the team and product owner de...
-
HCQM - Quality Improvement, Management, & Assurance Test| Questions Solved 100% Correct | Verified
- Exam (elaborations) • 17 pages • 2024
- Available in package deal
-
- $12.99
- + learn more
Statistical Control Charts - Answer Run charts (line graphs) upon which upper and lower standard deviation lines are drawn. Used to differentiate special cause events from common cause events as those with a special cause origin will usually occur outside the upper and lower standard deviations lines. Zigzagging occurring within the standard deviation lines on a control chart indicates this. - Answer Common cause.
-
OMIS 472 exam 2 Question and answers already passed
- Exam (elaborations) • 12 pages • 2024
- Available in package deal
-
- $13.49
- + learn more
OMIS 472 exam 2 Question and answers already passed OMIS 472 exam 2 pie charts are most effective at: A. none of the above B. illustrating how data are changing over a period of time C. comparing purchases by vendor D. highlighting proportionate relationships among variables E. displaying production by product line - correct answer highlighting proportionate relationships among variables radar charts enable us to: A. track things like boats and airplanes which are in geographical ...
-
TEST BANK for Using & Understanding Mathematics: A Quantitative Reasoning Approach 7th Edition by Jeffrey Bennett and William Briggs. All 12 Chapters. (complete Download). 431 Pages.
- Exam (elaborations) • 431 pages • 2024
-
- $17.99
- + learn more
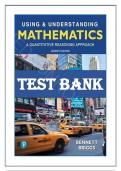
I. LOGIC AND PROBLEM SOLVING 1. Thinking Critically Activity: Bursting Bubble 1A. Living in the Media Age In Your World: Fact Checking on the Web 1B. Propositions and Truth Values 1C. Sets and Venn Diagrams Brief Review: Sets of Numbers 1D. Analyzing Arguments Mathematical Insight: Deductive Proof of the Pythagorean Theorem 1E. Critical Thinking in Everyday Life In Your World: Beware of “Up to” Deals 2. Approaches to Problem Solving Activity: Global Melting 2A. Understand, Solve, and Expla...

Do you wonder why so many students wear nice clothes, have money to spare and enjoy tons of free time? Well, they sell on Stuvia! Imagine your study notes being downloaded a dozen times for $15 each. Every. Single. Day. Discover all about earning on Stuvia


