Math 110 final ex Study guides, Class notes & Summaries
Looking for the best study guides, study notes and summaries about Math 110 final ex? On this page you'll find 278 study documents about Math 110 final ex.
Page 4 out of 278 results
Sort by

-
MATH 110 Final Exam Questions and Answers- Portage Learning
- Exam (elaborations) • 13 pages • 2024
- $11.49
- + learn more
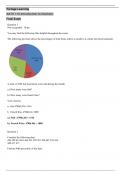
MATH 110 Final Exam Questions and Answers- Portage Learning Final Exam Question 1 Not yet graded / 10 pts You may find the following files helpful throughout the exam: The following pie chart shows the percentages of total items sold in a month in a certain fast food restaurant. A total of 4700 fast food items were sold during the month. a.) How many were fish? b.) How many were french fries? Your Answer: a. fish 4700(0.28)=1316 b. French fries 4700(0.4)=1880 a.) Fish : 4700(.28) = 1...
-
MATH 110 Final Exam-with 100% verified solutions-
- Exam (elaborations) • 9 pages • 2024
- $13.00
- + learn more
MATH 110 Final Exam-with 100% verified solutions-
-
MATH 110 Final Exam Questions and Answers- Portage Learning
- Exam (elaborations) • 13 pages • 2024
- $9.99
- + learn more
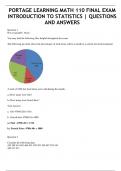
MATH 110 Final Exam Questions and Answers- Portage Learning A total of 4700 fast food items were sold during the month. a.) How many were fish? b.) How many were french fries? Your Answer: a. fish 4700(0.28)=1316 b. French fries 4700(0.4)=1880 a.) Fish : 4700(.28) = 1316 b.) French Fries: 4700(.40) = 1880
-
MATH 110 Final Exam- Requires Respondus LockDown Browser MATH 110: Introduction to Statistics, Portage Learning Statistics
- Exam (elaborations) • 34 pages • 2023
- $15.49
- + learn more
MATH 110 Final Exam- Requires Respondus LockDown Browser MATH 110: Introduction to Statistics, Portage Learning Statistics
-
PORTAGE LEARNING MATH 110 FINAL EXAM INTRODUCTION TO STATISTICS | QUESTIONS AND ANSWERS
- Exam (elaborations) • 9 pages • 2024
- $17.99
- + learn more
PORTAGE LEARNING MATH 110 FINAL EXAM INTRODUCTION TO STATISTICS | QUESTIONS AND ANSWERS

Fear of missing out? Then don’t!

-
MATH 110 Final Exam- Requires Respondus LockDown Browser MATH 110: Introduction to Statistics, Portage Learning Statistics
- Exam (elaborations) • 25 pages • 2023
- $15.49
- + learn more
MATH 110 Final Exam- Requires Respondus LockDown Browser MATH 110: Introduction to Statistics, Portage Learning Statistics
-
MATH 110 Final Exam Questions and Answers- Portage Learning latest solution
- Exam (elaborations) • 25 pages • 2023
- $14.99
- + learn more
MATH 110 Final Exam Questions and Answers- Portage Learning latest solution/MATH 110 Final Exam Questions and Answers- Portage Learning latest solution/MATH 110 Final Exam Questions and Answers- Portage Learning latest solution
-
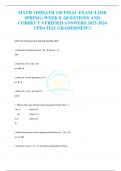
MATH 110|MATH 110 FINAL EXAM (LIME SPRING) WEEK 8 QUESTIONS AND CORRECT VERIFIED ANSWERS 2023-2024 UPDATE|A GRADED|NEW!!
- Exam (elaborations) • 5 pages • 2023
- $15.49
- + learn more
MATH 110|MATH 110 FINAL EXAM (LIME SPRING) WEEK 8 QUESTIONS AND CORRECT VERIFIED ANSWERS UPDATE|A GRADED|NEW!!

-
MATH 110 Final Exam (New-2023) / MATH110 Final Exam/ MATH 110 Statistics Final Exam/ MATH110 Statistics Final Exam: Portage Learning (Already graded A+)
- Exam (elaborations) • 9 pages • 2023
- $14.49
- + learn more
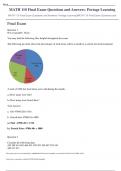
Final Exam MATH110 Statistics Final Exam: Portage Learning (Already graded A+) New-2023 Question 1 You may find the following files helpful throughout the exam: The following pie chart shows the percentages of total items sold in a month in a certain fast food restaurant. A total of 4700 fast food items were sold during the month. a.) How many were fish? b.) How many were french fries? Your Answer: a. fish 4700(0.28)=1316 b. French fries 4700(0.4)=1880 a.) Fish : 4700(...
-
Math 110 Final Exam Questions with 100% Correct Answers
- Exam (elaborations) • 10 pages • 2023
- $12.99
- + learn more
Determine the slope and the y-intercept. Use the slope and the y-intercept to graph the equation. Use a graphing calculator to verify your work. y=4x-8 Correct Answer Slope is m=4 Y-intercept= (0,-8) Determine the slope and the y-intercept. Use the slope and the y-intercept to graph the equation. y=1 Correct Answer Slope is m= 0 Y-intercept= (0,1) Use the graphing tool to graph the linear equation. Use the slope and y-intercept when drawing the line. 2x+y=1 Correct Answer Det...
