Frequency distributions - Study guides, Class notes & Summaries
Looking for the best study guides, study notes and summaries about Frequency distributions? On this page you'll find 840 study documents about Frequency distributions.
All 840 results
Sort by
 Popular
-
WGU Academy Statistics Quizzes And Answers (Graded A+!!!
- Exam (elaborations) • 9 pages • 2024
- $10.89
- 2x sold
- + learn more
WGU Academy Statistics Which of the following is true regarding a probability of an event P(A)? - ANS 0≤P(A)≤1 The probability of an event can any number between 0 and 1, including 0 and 1. In other words, the probability of an event cannot be more than 1 or less than 0. Which of the following represents the probability of an event that is more likely not to occur than it is to occur, but would not be unusual for it to occur? - ANS 0.32 1250 randomly chosen in...
-
TEST BANK for Basic Statistics for Business and Economics 10th Edition by Douglas A. Lind Updated A+ All Chapters
- Exam (elaborations) • 240 pages • 2023 Popular
- $17.49
- 2x sold
- + learn more
TEST BANK for Basic Statistics for Business and Economics 10th Edition by Douglas A. Lind Updated A+ All Chapters All 15 Chapters. Chapter 1: What is Statistics? Chapter 2: Describing Data: Frequency Tables, FrequencyDistributions, and Graphic Presentation Chapter 3: Describing Data: Numerical Measures Chapter 4: Describing Data: Displaying and Exploring Data Chapter 5: A Survey of Probability Concepts Chapter 6: Discrete Probability Distributions Chapter 7: Continuous Probability Distributions ...
-
Test Bank for Basic Statistics for Business & Economics, 7th Canadian Edition by Lind
- Exam (elaborations) • 802 pages • 2024
- $29.49
- 1x sold
- + learn more
Test Bank for Basic Statistics for Business & Economics 7ce 7th Canadian Edition by Douglas A. Lind, William G. Marchal, Samuel A. Wathen, Carol Ann Waite, Kevin Murphy. Full Chapters test bank are included - Chapter 1 to 17 CHAPTER 1: What Is Statistics? CHAPTER 2: Describing Data: Frequency Tables, Frequency Distributions and Graphic Presentation CHAPTER 3: Describing Data: Numerical Measures CHAPTER 4: A Survey of Probability Concepts CHAPTER 5: Discrete Probability Distributions CHAP...
-
Test Bank for Statistics for the Behavioral Sciences 10th Edition by Frederick Gravetter, Larry B. Wallnau | All Chapters Included | Complete Latest Guide A+.
- Exam (elaborations) • 21 pages • 2024
- $22.99
- 1x sold
- + learn more
Test Bank for Statistics for the Behavioral Sciences 10th Edition by Frederick Gravetter, Larry B. Wallnau | All Chapters Included | Complete Latest Guide A+. 1. What is the total number of scores for the distribution shown in the following table? X f 4 3 3 5 2 4 1 2 a. 4 b. 10 c. 14 d. 37 ANSWER: c REFERENCES: 2.1 Frequency Distributions and Frequency Distribution Tables QUESTION TYPE: Multiple Choice KEYWORDS: Bloom’s: Understand 2. A sample of n = 15 scores ranges from a high...
-
Solutions for Statistical Techniques in Business and Economics, 19th Edition Lind (All Chapters included)
- Exam (elaborations) • 360 pages • 2023
- $29.49
- 1x sold
- + learn more
Complete Solutions Manual for Statistical Techniques in Business and Economics, 19th Edition by Douglas A. Lind, William G. Marchal, Samuel A. Wathen ; ISBN13: 9781265322465. (Full Chapters included Chapter 1 to 20). Ch. 19 and 20 solutions not available... 1. What Is Statistics?. 2. Describing Data: Frequency Tables, Frequency Distributions, and Graphic Presentation. 3. Describing Data: Numerical Measures. 4. Describing Data: Displaying and Exploring Data. 5. A Survey of Probability Concep...

As you read this, a fellow student has made another $4.70

-
TEST BANK for Basic Statistics for Business and Economics 10th Edition by Douglas A. Lind. ISBN 9781264086870. All 15 Chapters.
- Exam (elaborations) • 512 pages • 2023
- $29.94
- 2x sold
- + learn more
TEST BANK for Basic Statistics for Business and Economics 10th Edition by Douglas A. Lind. ISBN 6870. All 15 Chapters. Chapter 1: What is Statistics? Chapter 2: Describing Data: Frequency Tables, FrequencyDistributions, and Graphic Presentation Chapter 3: Describing Data: Numerical Measures Chapter 4: Describing Data: Displaying and Exploring Data Chapter 5: A Survey of Probability Concepts Chapter 6: Discrete Probability Distributions Chapter 7: Continuous Probability Distributions Chapter 8: S...
-
Test Bank for An Introduction to Statistics, An Active Learning Approach, 3rd Edition Carlson (All Chapters included)
- Exam (elaborations) • 157 pages • 2023
- $29.49
- 1x sold
- + learn more
Complete Test Bank for An Introduction to Statistics, An Active Learning Approach, 3rd Edition by Kieth A. Carlson, Jennifer R. Winquist ; ISBN13: 9781544375090. (Full Chapters included Chapter 1 to 11)..... Chapter 1: Introduction to Statistics and Frequency Distributions. Chapter 2: Central Tendency and Variability. Chapter 3: z scores. Chapter 4: Sampling Error and Confidence Intervals with z and t Distributions. Chapter 5: Single sample t, effect sizes, and confidence intervals. Chapte...
-
Hawkes Learning Lesson 3.4 Frequency Distributions Graded A
- Exam (elaborations) • 6 pages • 2023
- $9.99
- + learn more
Hawkes Learning Lesson 3.4 Frequency Distributions Graded A The following data describes high temperatures, in °F, for a resort during a period in July. Complete the frequency table for this data. 91.9 84.1 80.9 83.8 87.0 81.8 83.7 91.8 92.5 85.5 89.8 85.0 81.9 94.1 92.6 84.1 80.5 84.7 Determine the frequency of each class in the table shown. Photo of graph on my phone (High Temperatures, in degrees Farenheit, for a Resort during a Period in July) Consider the following fre...

-
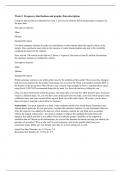
MATH302 Week 2 Discussion; Frequency distributions and graphs; Data description
- Other • 2 pages • 2023
- $18.48
- + learn more
Week 2: Frequency distributions and graphs; Data description Using the data set that you identified in week 1, use Excel to find the following descriptive statistics for the price data. Descriptive statistics: Mean Median Standard Deviation Use these summary statistics to make two conclusions or observations about the typical vehicle in the sample. One conclusion must relate to the measure of center (mean/median) and one to the variability (standard deviation) of the vehicles. Next,...
-
Test Bank for Ecology: The Economy of Nature 9th Edition by Rick Relyea
- Exam (elaborations) • 443 pages • 2023
- $29.49
- 8x sold
- + learn more
Test bank for Ecology: The Economy of Nature 9e 9th Edition by Rick Relyea. ISBN-13: 5542 Full Chapters test bank included Chapter 1 An Introduction to Ecology 1.1 Ecological Systems Exist in A Hierarchy of Organization Individuals Populations Communities Ecosystems The Landscape The Biosphere 1.2 Physical and Biological Principles Govern Ecological Systems Conservation of Matter and Energy Dynamic Steady States Evolution 1.3 Different Organisms Play Diverse Roles in Ecological...
-
MATH302 Week 2 Discussion; Frequency distributions and graphs; Data description.docx
- Other • 2 pages • 2023
- $18.48
- + learn more
Week 2: Frequency distributions and graphs; Data description Using the data set that you identified in week 1, use Excel to find the following descriptive statistics for the price data. Descriptive statistics: Mean Median Standard Deviation Use these summary statistics to make two conclusions or observations about the typical vehicle in the sample. One conclusion must relate to the measure of center (mean/median) and one to the variability (standard deviation) of the vehicles. Next,...
