M outliers Study guides, Class notes & Summaries
Looking for the best study guides, study notes and summaries about M outliers? On this page you'll find 125 study documents about M outliers.
All 125 results
Sort by
 Popular
-
ISYE 6501 Final Quiz latest 2023
- Exam (elaborations) • 32 pages • 2024
- $17.99
- 1x sold
- + learn more
Skip to document Search for courses, books or documents University High School Books Sign in Information AI Chat GT Students Final Quiz ISYE6501x Courseware ed X GT Students Final Quiz ISYE6501x Courseware ed X Course Elementary Italian (ITAL 1) University Pasadena City College Academic year: 2021/2022 Uploaded by: Anonymous Student Pasadena City College Recommended for you 11 Med surg Immunity HIV AIDS Lecture Notes Med surg Immunity HIV AIDS Lecture Notes...
-
WGU C955 Applied Probability and statistics Exam Study Guide
- Exam (elaborations) • 15 pages • 2024
- $8.00
- + learn more
Pie chart numerical measure: percentages best used When displaying categories as parts of the whole Bar chart (bar graph) Category counts or frequencies best used when displaying counts or frequencies for each category individually Dot Plot 5-number summary (max, Q1, median, Q3, max) Smaller data set; useful to display the distribution and show gaps and outliers (quantitative) Stem Plot (stem-and-leaf plot) 5-number summary (max, Q1, median, Q3, max) Smaller data sets; useful to disp...
-
AP Statistics Chapters 1-10 Complete Exam Review Questions With Complete Solutions
- Exam (elaborations) • 29 pages • 2023
- $12.99
- + learn more
Marginal Distribution correct answer: The distribution of values of a variable among all individuals described by the table. (Percent of something out of the total) Conditional Distribution correct answer: The distribution of values of a variable among individuals who have a specific value of another variable. (Percent of a specific something out of that specific total) Association correct answer: When specific values of one variable tend to occur in common with specific values of anoth...
-
Test Bank for Applied Statistics II, Multivariable and Multivariate Techniques, 3rd Edition Warner (All Chapters included)
- Exam (elaborations) • 142 pages • 2023
- $29.49
- + learn more
Complete Test Bank for Applied Statistics II, Multivariable and Multivariate Techniques, 3rd Edition by Rebecca M. Warner ; ISBN13: 9781544398723. (Full Chapters included Chapter 1 to 17).....1. The New Statistics. 2. Advanced Data Screening: Outliers and Missing Values. 3. Statistical Control: What Can Happen When You Add a Third Variable?. 4. Regression Analysis and Statistical Control. 5. Multiple Regression With Multiple Predictors. 6. Dummy Predictor Variables in Multiple Regression. ...
-
PL-300 EXAM 2024|GUARANTEED EXAM QUESTIONS WITH ACCURATE ANSWERS
- Exam (elaborations) • 118 pages • 2024
- $19.79
- + learn more
PL-300 EXAM 2024 PL-300 EXAM 2024|GUARANTEED EXAM QUESTIONS WITH ACCURATE ANSWERS You need to identify the percentage of empty values in each column as quickly as possible. What data preview option do you select? - Accurate AnswerColumn Quality. You need to identify outliers in a text column. Which data preview option do you select? - Accurate AnswerTop and bottom values in Value Distribution. What is the relationship between the fact table and the dimension tables? - Accurate Answe...

And that's how you make extra money

-
Malcolm Gladwell – Outliers UPDATED ACTUAL Exam Questions and CORRECT Answers
- Exam (elaborations) • 20 pages • 2024
- $8.99
- + learn more
Malcolm Gladwell – Outliers UPDATED ACTUAL Exam Questions and CORRECT Answers quarry (n) - CORRECT ANSWER- a place, typically a large, deep pit, from which stone or other materials are or have been extracted. compatriots - CORRECT ANSWER- fellow countrymen Convent - CORRECT ANSWER- A community of nuns fractious - CORRECT ANSWER- tending to argue or cause discord
-
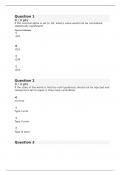
Liberty University: EDCO 735 Applied Statistics Quizzes 2-1-5 Fall 2023/24.
- Exam (elaborations) • 48 pages • 2023
- $15.59
- + learn more
EDCO 735 Quiz 2-1 EDCO 735 Quiz 2-2 EDCO 735 Quiz 2-3. EDCO 735 Quiz 2-4 EDCO 735 Quiz 2-5 Question 1 0 / 3 pts If the nominal alpha is set to .05, what p value would not be considered statistically significant? .222 You Answered .022 .034 .033 Question 2 3 / 3 pts If the state of the world is that the null hypothesis should not be rejected and researchers fail to reject it, they have committed: Correct! no error Type I error Type II error Type III error Question 3 3 / ...
-
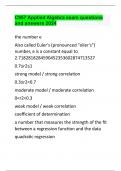
C957 Applied Algebra exam questions and answers 2024
- Exam (elaborations) • 9 pages • 2024
- $14.49
- + learn more
the number e Also called Euler's (pronounced "oiler's") number, e is a constant equal to 2. 0.7≤r2≤1 strong model / strong correlation 0.3≤r2<0.7 moderate model / moderate correlation 0<r2<0.3 weak model / weak correlation coefficient of determination a number that measures the strength of the fit between a regression function and the data quadratic regression A regression that finds the best-fit curve based on at least three data points. li...
-
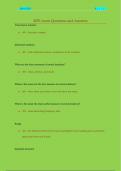
RPE exam Questions and Answers
- Exam (elaborations) • 16 pages • 2024
- $10.49
- + learn more
Descriptive statistics o :## describe a sample Inferential statistics o :## make inferences about a population from a sample What are the three measures of central tendency? o :## mean, median, and mode When is the mean not the best measure of central tendency? o :## when there are outliers; they will skew the mean When is the mode the most useful measure of central tendency? o :## when describing frequency data Range o :## the distance between the lowest and highest scores (taking in...
-
Applied Algebra - C957 actual exam with 100% correct answers(latest update)
- Exam (elaborations) • 5 pages • 2024
- $14.99
- + learn more
The Constant e 2.71828... slope-intercept form y=mx+b, where m is the slope and b is the y-intercept of the line. Logistic Function Equation Upper Limit L+m Logistic Function Equation Lower Limit m Logistic Function Equation Rate of increase k Logistic Function Equation Start of increase C Function that is a strait line linear Function with curves and no Asymptote polynomial strong correlation 0.7-1.0 moderate correlation 0...

-
WGU C955 TEST WITH COMPLETE SOLUTIONS
- Exam (elaborations) • 17 pages • 2023
- $13.99
- + learn more
median vs IQR skewed data uses these for center and spread Histogram - when to use Based on the shape of the distribution, uses mean + standard deviation OR median + IQR to describe center and spread - Larger data sets; shows shapes of distribution and potential outliers; ignores the individual data valuesl Histogram Skewed right Not a symmetric distribution, the tail is on the right Standard Deviation Rule 68% of the data are within 1 standard deviation, 95% are...
