Stat 200 homework week 7 Study guides, Class notes & Summaries
Looking for the best study guides, study notes and summaries about Stat 200 homework week 7? On this page you'll find 134 study documents about Stat 200 homework week 7.
All 134 results
Sort by

-
STAT 200 Week 7 Homework Problems (GRADED A) Questions and Answers (Verified Solutions)
- Exam (elaborations) • 8 pages • 2023
- $9.49
- + learn more
STAT 200 Week 7 Homework Problems (GRADED A) Questions and Answers (Verified Solutions)

-
STAT 200 Week 7 Homework Problems (Already Graded A)
- Exam (elaborations) • 8 pages • 2023
- $9.69
- + learn more
STAT 200 Week 7 Homework Problems (Already Graded A)
-
STAT 200 Week 7 Homework Problems Solutions (Approach-1), University of Maryland University College (UMUC)
- Exam (elaborations) • 9 pages • 2022
- $17.99
- + learn more
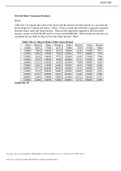
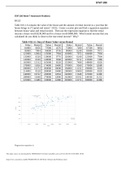
STAT 200 Week 7 Homework Problems 10.1.2 Table #10.1.6 contains the value of the house and the amount of rental income in a year that the house brings in ("Capital and rental," 2013). Create a scatter plot and find a regression equation between house value and rental income. Then use the regression equation to find the rental income a house worth $230,000 and for a house worth $400,000. Which rental income that you calculated do you think is closer to the true rental income? Why? Table ...
-
STAT 200 Week 2 Homework Problems and Solutions _ All Answers are Correct
- Exam (elaborations) • 8 pages • 2023
- $9.99
- + learn more
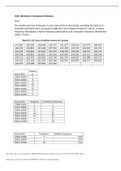
STAT 200 Week 2 Homework Problems 2.2.2 The median incomes of females in each state of the United States, including the District of Columbia and Puerto Rico, are given in table #2.2.10 ("Median income of," 2013). Create a frequency distribution, relative frequency distribution, and cumulative frequency distribution using 7 classes. Table #2.2.10: Data of Median Income for Females $31,862 $40,550 $36,048 $30,752 $41,817 $40,236 $47,476 $40,500 $60,332 $33,823 $35,438 $37,242 $31,238 $39...
-
STAT 200 Week 7 Homework Problems Solutions (Approach-1), University of Maryland University College (UMUC)
- Exam (elaborations) • 8 pages • 2023
- $17.99
- + learn more
STAT 200 Week 7 Homework Problems 10.1.2 Table #10.1.6 contains the value of the house and the amount of rental income in a year that the house brings in ("Capital and rental," 2013). Create a scatter plot and find a regression equation between house value and rental income. Then use the regression equation to find the rental income a house worth $230,000 and for a house worth $400,000. Which rental income that you calculated do you think is closer to the true rental income? Why? Table ...

And that's how you make extra money

-
STAT 200 STAT200 WEEK 7 HOMEWORK with accurate SOLUTION (UMUC)
- Exam (elaborations) • 8 pages • 2022
- $11.00
- + learn more
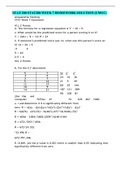
STAT 200 STAT200 WEEK 7 HOMEWORK with accurate SOLUTION (UMUC) STAT 200 STAT200 WEEK 7 HOMEWORK SOLUTION (UMUC) Anquanette Sterling STAT Week 7 Homework #1) 2 Points 2. The formula for a regression equation is Y’ = 2X + 9. a. What would be the predicted score for a person scoring 6 on X? Y = 2(6) + 9 = 12+9 = 21 b. If someone’s predicted score was 14, what was this person’s score on X? 14 = 2X + 9 -9 -9 5 = 2X 2.5 = X #2) 2 Points 6. For the X,Y data below ...

-
Stat 200 Week 7 Homework Problems
- Exam (elaborations) • 12 pages • 2022
- $16.49
- + learn more
Stat 200 Week 7 Homework Problems To find if the activity and time of day are independent do a Chi-Square Test for Independence. E is the expected frequency and O is the observed frequency. HO=A partial activity and the time of day are independent for dolphins. HA= A partial activity and the time of day are not independent for dolphins. --------------------TO CONTINUE -------------------- DOWNLOAD NOW FOR GOOD GRADES
-
STAT 200 Week 3 Homework Problems
- Exam (elaborations) • 6 pages • 2022
- $7.99
- + learn more
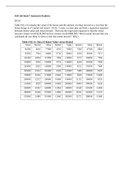
STAT 200 Week 3 Homework Problems. A project conducted by the Australian Federal Office of Road Safety asked people many questions about their cars. One question was the reason that a person chooses a given car, and that data is in table #4.1.4 ("Car preferences," 2013). Table #4.1.4: Reason for Choosing a Car Safety Reliability Cost Performance Comfort Looks 84 62 46 34 47 27 Find the probability a person chooses a car for each of the given reasons. Total: 84+62+46+34+47+27=300 Safety...

-
MATH302 WEEK 8 PRACTISE TEST
- Exam (elaborations) • 19 pages • 2022
- $10.49
- + learn more
MATH302 WEEK 8 PRACTISE TEST 2/27/2020 APUS CLE : MATH302 B007 Win 20 : Tests & Quizzes 0.0/ 1.0 Points 1.0/ 1.0 Points Week 8 Knowledge Check Homework Practice Questions Return to Assessment List Part 1 of 4 - Chi-Square Test for Homogeneity 4.0/ 8.0 Points Question 1 of 20 Click to see additional instructions A college prep school advertises that their students are more prepared to succeed in college than other schoverify this, they categorize GPA’s into 4 groups and look up the...
-
STAT 200 Week 1 to week 7
- Package deal • 7 items • 2022
- $40.49
- + learn more
STAT 200 Week 7 Homework Problems Exam (elaborations) STAT 200 Week 5 Homework Problems Exam (elaborations) STAT 200 Week 2 Homework Problems Exam (elaborations) STAT 200 Week 4 Homework Problems Exam (elaborations) STAT 200 Week 6 Homework Problems. Exam (elaborations) STAT 200 Assignment #3: Inferential Statistics Analysis and Writeup
