Stat 200 week 7 homework Study guides, Class notes & Summaries
Looking for the best study guides, study notes and summaries about Stat 200 week 7 homework? On this page you'll find 134 study documents about Stat 200 week 7 homework.
All 134 results
Sort by

-
STAT 200 Week 7 Homework Problems (GRADED A) Questions and Answers (Verified Solutions)
- Exam (elaborations) • 8 pages • 2023
- $9.49
- + learn more
STAT 200 Week 7 Homework Problems (GRADED A) Questions and Answers (Verified Solutions)
-
STAT 200 Week 7 Homework Problems Solutions (Approach-1), University of Maryland University College (UMUC)
- Exam (elaborations) • 9 pages • 2022
- $17.99
- + learn more
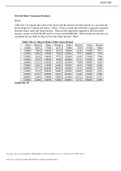
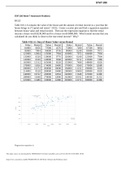
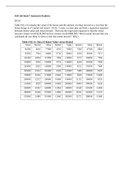
STAT 200 Week 7 Homework Problems 10.1.2 Table #10.1.6 contains the value of the house and the amount of rental income in a year that the house brings in ("Capital and rental," 2013). Create a scatter plot and find a regression equation between house value and rental income. Then use the regression equation to find the rental income a house worth $230,000 and for a house worth $400,000. Which rental income that you calculated do you think is closer to the true rental income? Why? Table ...
-
STAT 200 Week 7 Homework Problems Solutions (Approach-1), University of Maryland University College (UMUC)
- Exam (elaborations) • 8 pages • 2023
- $17.99
- + learn more
STAT 200 Week 7 Homework Problems 10.1.2 Table #10.1.6 contains the value of the house and the amount of rental income in a year that the house brings in ("Capital and rental," 2013). Create a scatter plot and find a regression equation between house value and rental income. Then use the regression equation to find the rental income a house worth $230,000 and for a house worth $400,000. Which rental income that you calculated do you think is closer to the true rental income? Why? Table ...
-
STAT 200 STAT200 WEEK 7 HOMEWORK with accurate SOLUTION (UMUC)
- Exam (elaborations) • 8 pages • 2022
- $11.00
- + learn more
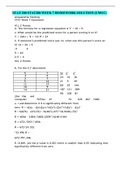
STAT 200 STAT200 WEEK 7 HOMEWORK with accurate SOLUTION (UMUC) STAT 200 STAT200 WEEK 7 HOMEWORK SOLUTION (UMUC) Anquanette Sterling STAT Week 7 Homework #1) 2 Points 2. The formula for a regression equation is Y’ = 2X + 9. a. What would be the predicted score for a person scoring 6 on X? Y = 2(6) + 9 = 12+9 = 21 b. If someone’s predicted score was 14, what was this person’s score on X? 14 = 2X + 9 -9 -9 5 = 2X 2.5 = X #2) 2 Points 6. For the X,Y data below ...

-
Stat 200 Week 7 Homework Problems
- Exam (elaborations) • 12 pages • 2022
- $16.49
- + learn more
Stat 200 Week 7 Homework Problems To find if the activity and time of day are independent do a Chi-Square Test for Independence. E is the expected frequency and O is the observed frequency. HO=A partial activity and the time of day are independent for dolphins. HA= A partial activity and the time of day are not independent for dolphins. --------------------TO CONTINUE -------------------- DOWNLOAD NOW FOR GOOD GRADES

Get paid weekly? You can!


-
STAT 200 Week 7 Homework Problems (Already Graded A)
- Exam (elaborations) • 8 pages • 2023
- $9.69
- + learn more
STAT 200 Week 7 Homework Problems (Already Graded A)
-
STAT 200 Week 7 Homework Problems
- Exam (elaborations) • 11 pages • 2022
- $15.49
- + learn more
Table #10.1.6 contains the value of the house and the amount of rental income in a year that the house brings in ("Capital and rental," 2013). Create a scatter plot and find a regression equation between house value and rental income. Then use the regression equation to find the rental income a house worth $230,000 and for a house worth $400,000. Which rental income that you calculated do you think is closer to the true rental income? Why? Table #10.1.6: Data of House Value versus Rental ...
-
STAT 200 Week 2 Homework Problems and Solutions _ All Answers are Correct
- Exam (elaborations) • 8 pages • 2023
- $9.99
- + learn more
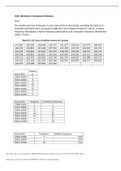
STAT 200 Week 2 Homework Problems 2.2.2 The median incomes of females in each state of the United States, including the District of Columbia and Puerto Rico, are given in table #2.2.10 ("Median income of," 2013). Create a frequency distribution, relative frequency distribution, and cumulative frequency distribution using 7 classes. Table #2.2.10: Data of Median Income for Females $31,862 $40,550 $36,048 $30,752 $41,817 $40,236 $47,476 $40,500 $60,332 $33,823 $35,438 $37,242 $31,238 $39...
-
STAT 200 Week 7 Homework Problems (1).pdf
- Exam (elaborations) • 9 pages • 2022
- $11.99
- + learn more
STAT 200 Week 7 Homework Problems (1).pdfSTAT 200 Week 7 Homework Problems (1).pdfSTAT 200 Week 7 Homework Problems (1).pdfSTAT 200 Week 7 Homework Problems (1).pdfSTAT 200 Week 7 Homework Problems (1).pdf
-
STAT 200 Week 3 Homework Problems
- Exam (elaborations) • 6 pages • 2022
- $7.99
- + learn more
STAT 200 Week 3 Homework Problems. A project conducted by the Australian Federal Office of Road Safety asked people many questions about their cars. One question was the reason that a person chooses a given car, and that data is in table #4.1.4 ("Car preferences," 2013). Table #4.1.4: Reason for Choosing a Car Safety Reliability Cost Performance Comfort Looks 84 62 46 34 47 27 Find the probability a person chooses a car for each of the given reasons. Total: 84+62+46+34+47+27=300 Safety...
