Stem plot - Study guides, Class notes & Summaries
Looking for the best study guides, study notes and summaries about Stem plot? On this page you'll find 418 study documents about Stem plot.
All 418 results
Sort by
-
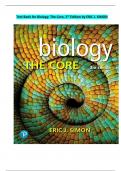
Biology: The Core 3rd Edition Exam Questions and 100% Correct Answers| Eric J. Simon
- Exam (elaborations) • 110 pages • 2023
- Available in package deal
-
- $17.99
- 1x sold
- + learn more
***Download Test Bank Immediately After the Purchase. Just in case you have trouble downloading, kindly message me, and I will send it to you via Google Doc or email. Thank you*** Biology: The Core 3rd Edition Exam Questions and 100% Correct Answers| Eric J. Simon The Test Bank for Biology: The Core, 3rd Edition by Eric J. Simon is a comprehensive study tool designed to aid in the understanding of fundamental concepts in biology. It contains a series of questions and answers that align with th...
 Popular
-
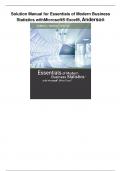
Solution Manual for Essentials of Modern Business Statistics with Microsoft® Excel®, Anderson
- Exam (elaborations) • 817 pages • 2024 Popular
-
- $47.09
- 1x sold
- + learn more
Solution Manual for Essentials of Modern Business Statistics withMicrosoft® Excel®,Anderson Chapter 1 Data and Statistics Learning Objectives 1. Obtain an appreciation for the breadth of statistical applications in business and economics. 2. Understand the meaning of the terms elements, variables, and observations as they are used in statistics. 3. Obtain an understanding of the difference between categorical, quantitative, crossectional and time series data. 4. Learn about the sou...
-
MIP2602 assignment 4 (DETAILED ANSWERS) 2024 (225269) -DUE 25 August 2024
- Exam (elaborations) • 20 pages • 2023
- Available in package deal
-
- $2.71
- 18x sold
- + learn more
MIP2602 assignment 4 (DETAILED ANSWERS) 2024 () -DUE 25 August 2024 100% TRUSTED workings, explanations and solutions. For assistance call or us on . Question 1 1.1 What type(s) of data are best for using the following? 1.1.1 A stem-and-leaf plot (2) 1.1.2 A bar chart (2) 1.1.3 Pie chart (2) 1.1.4 Scatter plot (2) 1.1.5 Line graph (2) 1.1.6 A histogram (1) 1.1.7 Box-and-whisker plot (1) 1.2 How is the bar graph better than the pictograph? (4) 1.3 When should we make use of...
-
MIP2602 ASSIGNMENT 4 2023
- Other • 10 pages • 2023
-
- $3.01
- 2x sold
- + learn more
Question 1 1.1 What type(s) of data are best for using the following? 1.1.1 A stem-and-leaf plot: Stem-and-leaf plots are best suited for displaying small to moderate-sized datasets of quantitative data. They help you understand the distribution of the data and show individual data points.
-
WGU C955 - Module 4: Descriptive Statistics for a Single Variable, Top Exam Questions and answers, graded A+
- Exam (elaborations) • 17 pages • 2023
- Available in package deal
-
- $12.49
- 1x sold
- + learn more
WGU C955 - Module 4: Descriptive Statistics for a Single Variable, Top Exam Questions and answers, graded A+ If 200 people are surveyed, how many claim to have had no exercise? {{ Pie chart reflecting the average number of hours exercised per week. No exercise 36%, 1 - 2 hours 28%, 3 - 4 hours 12%, 4 - 5 hours 10%, 5 - 6 hours 8%, 6 - 7 hours 4%, more than 7 hours 2%. }} a 18 b 36 c 72 d Cannot determine - -72 Determine the range for the following data set. {1,24,26,28,32,36...
-
NSG-522 Midterm Questions And Answers
- Exam (elaborations) • 11 pages • 2023
-
- $11.99
- 1x sold
- + learn more
The frequency and relative frequency presented as a percentage should both be reported when describing interval level data - Answer- False What type of graphic display would be the best for a variable measured at the ordinal data? - Answer- Histogram The operational definition of a variable - Answer- Specifies how a variable should be measured The epidemiological range is - Answer- the minimum and maximum values When reporting the mean for a variable, what measure of spread should be...
-
BUSI 820 Quantitative Analysis; DESCRIPTIVE STATISTICS, ORDINAL SCALE AND DICHOTOMOUS VARIABLE 2024 with complete solution; Liberty University
- Exam (elaborations) • 17 pages • 2024
-
- $15.49
- + learn more
BUSI 820 Quantitative Analysis; DESCRIPTIVE STATISTICS, ORDINAL SCALE AND DICHOTOMOUS VARIABLE 2024 with complete solution; Liberty University Descriptive Statistics, Ordinal Scale and Dichotomous Variable 3 4.1. (a) Compute skewness for variables with five or more ordered levels 4 4.1. (b) Describe the results 4 4.1. (c) Which variables in the dataset are approximately normally distributed/scale? 5 4.1. (d) Which ones are ordered but not normal? 6 4.2. (a) Do a stem-and-leaf plot for th...
-
WGU C955 Applied Probability and Statistics Final Exam (New 2023/ 2024 Update) Questions and Verified Answers_ 100% Correct_ Graded A
- Exam (elaborations) • 38 pages • 2024
- Available in package deal
-
- $10.99
- + learn more
WGU C955 Applied Probability and Statistics Final Exam (New 2023/ 2024 Update) Questions and Verified Answers_ 100% Correct_ Graded A QUESTION what are the four graphical displays for quantitative data? Answer: dot plot, stem plot( or steam and leaf plot), box plot, and histogram QUESTION best to display the distribution of data, particularly clusters, gaps, and outliers. Most useful for smaller data sets Answer: dot plot QUESTION best to display the distr...
-
WGU C784 Final Exam (Latest 2024/ 2025 Update) Applied Healthcare Statistics | Questions and Verified Answers| 100% Correct| Grade A
- Exam (elaborations) • 26 pages • 2024
- Available in package deal
-
- $10.99
- + learn more
WGU C784 Final Exam (Latest 2024/ 2025 Update) Applied Healthcare Statistics | Questions and Verified Answers| 100% Correct| Grade A Q: Measures of the center of a data set are the Answer: mean, median, and mode Q: To find the range, Answer: simply subtract the minimum from the maximum. Q: Quartiles Answer: are values that divide a data set into four equally sized groups. Q: interquartile range Answer: measures the difference between the third quartile and t...
-
STA1501 ASSIIFGMENT 1 (2023)
- Exam (elaborations) • 9 pages • 2023
-
- $3.01
- 4x sold
- + learn more
in this assignment we Explore various types of data and learn how to organize, visualize, and analyze them effectively. Master the art of descriptive statistics, including mean, median, mode, variance, and standard deviation.
-
Business Statistics and Analytics in Practice 9th Edition Bowerman Test Bank
- Exam (elaborations) • 1963 pages • 2022
-
- $16.73
- 2x sold
- + learn more
Student name:__________ TRUE/FALSE - Write 'T' if the statement is true and 'F' if the statement is false. 1) A stem-and-leaf display is a graphical portrayal of a data set that shows the data set's overall pattern of variation. ⊚ true ⊚ false 2) The relative frequency is the frequency of a class divided by the total number of measurements. ⊚ true ⊚ false 3) A bar chart is a graphic that can be used to depict qualitative data. ⊚ true ⊚ false 4) Stem-and-leaf displays and dot plo...

How did he do that? By selling his study resources on Stuvia. Try it yourself! Discover all about earning on Stuvia


