100% de satisfacción garantizada Inmediatamente disponible después del pago Tanto en línea como en PDF No estas atado a nada
logo-home
Financial Econometrics 8,40 €
Añadir al carrito

Notas de lectura

Financial Econometrics

 9 veces vendidas
  • Grado
  • Institución

FR2202 Financial Econometrics Notes, for City University London students, contain an overview of every topic covered within the module. Summarised into a 16-page single document, the notes were prepared using both lecture notes, in-class discussions and core textbook (ISBN: 6823) This lecture n...

[Mostrar más]
Vista previa 3 fuera de 16  páginas

  • 22 de julio de 2021
  • 16
  • 2014/2015
  • Notas de lectura
  • N/a
  • Todas las clases
avatar-seller
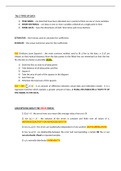
The 3 TYPES OF DATA:

1) TIME SERIES – are data that have been allocated over a period of time on one or more variables
2) CROSS-SECTIONAL – are data on one or more variables collected at a single point in time
3) PANEL DATA – have the dimensions of both Time Series and Cross-Sections


ESTIMATOR – the formula used to calculate the coefficients

ESTIMATE – the actual numerical value for the coefficients


OLS (Ordinary Least Squares) – the most common method used to fit a line to the data. α & β are
chosen so that vertical distances from the data points to the fitted line are minimized (so that the line
fits the data as closely as possible) STEPS:

1) Draw the line as close to all data points
2) Take distance of all data points and line
3) Square it
4) Take the area of each of the squares in the diagram
5) Sum them up
6) Minimize the total sum of the squares

RSS = SSR (∑ u^ 2 t ) - is an amount of difference between actual data and estimation model. It is a
regression function which explains a greater amount of data. A SMALL RSS INDICATES A TIGHT FIT OF
THE MODEL TO THE DATA.


ASSUMPTIONS ABOUT THE ERROR TERMS:

1) E(ut) = 0 - the errors have zero mean (the average value of errors is 0)

2) Var (ut) = σ2 - the variance of the errors is constant and finite over all values of x t
(HETEROSCEDASTICITY OR HOMOSCEDASTICITY)

3) Cov (ui,uj)=0 - the errors are statistically independent of one another (AUTOCORRELATION)

4) Cov (ut,xt)=0 - no relationship between the error and corresponding x variate OR the x’s are
non-stochastic /fixed in repeated samples

5) ut is normally distributed (NORMALITY)

,If assumptions 1 through 4 hold, then the estimators α^ and ^β determined by OLS are known as BEST
LINEAR UNBIASED ESTIMATORS (BLUE) and hypothesis tests regarding coefficient estimates (βs) can be
validly conducted.


PROPERTIES OF THE OLS ESTIMATOR:

• BEST - means that the OLS estimator ^β has minimum variance among the class of linear unbiased
estimators.

• LINEAR –α^ and ^β are linear estimators

^ and ^β will be equal to the true values
• UNBIASED - on average, the estimated values of the α

^ and ^β are estimators of the true value of α and β
• ESTIMATOR - α

SIMPLE linear regression model yt = α + βxt + ut that has been derived above, together with the
assumptions listed above, is known as the CLASSICAL LINEAR REGRESSION MODEL (CLRM).


Under these 4 assumptions, the OLS estimator can be:
- CONSISTENT – the least square estimators α^ and ^β are consistent. For an infinite number of
observations, the probability of the estimator being different from the true value is zero. If an
estimator is inconsistent, then even if we had an infinite amount of data, we could not be sure that
the estimated value will be close to its true value. The estimates will converge to their true values as
the sample size increases to infinity. That is, ^β → β as n → ∞
- UNBIASED – the least square estimates of α ^ and ^β are unbiased. That is E(α^ )= α and E( ^β )= β . Thus
on average the estimated values for the coefficients will be equal to their true values. Unbiasedness
is a stronger condition than consistency, since it holds for small as well as large samples. But not all
unbiased estimators are consistent. An unbiased estimator is consistent if its variance falls as the
sample size increases
- EFFICIENT – an estimator ^β of parameter β is said to be efficient if it is unbiased and no other
estimator has a smaller variance. If the estimator is efficient, we are minimizing the probability that
it is a long way off from the true value of β


yt – regressand, effect variable, explained variable, dependent variable
xt – regressor, causal variable, explanatory variable, independent variable
ut – error, residual, disturbance, noise

, SE – is A MEASURE OF RELIABILITY OR precision of the estimators ( α^ and ^β ). It is useful to know whether
one can have confidence in the estimates, and whether they are likely to vary much from one sample to
another within the given population. If the SE is small, it shows that the coefficients are likely to be
precise on average, NOT how precise they are for this particular sample. THE LOWER IT IS, THE BETTER
(means it is getting precise). IT IS LOWER WHEN: the sample size is large and when RSS (=SSR) is large

^ ) and SE ( ^β ) are the standard errors (OR standard deviation) of the coefficient estimates
SE(α

∑ u^ 2 t . THE SMALLER IT IS,
SE of the SIMPLE regression model OR the variance of the error (s) =

THE CLOSER IS THE FIT OF THE LINE TO THE ACTUAL DATA.
√ T −2


2 WAYS of conducting a HYPOTHESIS TEST:

H0: (no correlation between ‘x’ and ‘y’ – BAD NEWS!!!)

^β−β *
1) TEST OF SIGNIFICANCE approach = t T −2
SE( β^ )
Significance level N(0,1)
50% 0
5% 1.64
2.5% 1.96
0.5% 2.57
2) CONFIDENCE INTERVAL approach

If the β * lies within the confidence interval, ACCEPT H 0!!!


NOTE: If we reject the null hypothesis at the 5% level, we say that the result of the test is statistically
significant. We usually reject the null hypothesis if the test statistic is statistically significant at a
chosen significance level.

Los beneficios de comprar resúmenes en Stuvia estan en línea:

Garantiza la calidad de los comentarios

Garantiza la calidad de los comentarios

Compradores de Stuvia evaluaron más de 700.000 resúmenes. Así estas seguro que compras los mejores documentos!

Compra fácil y rápido

Compra fácil y rápido

Puedes pagar rápidamente y en una vez con iDeal, tarjeta de crédito o con tu crédito de Stuvia. Sin tener que hacerte miembro.

Enfócate en lo más importante

Enfócate en lo más importante

Tus compañeros escriben los resúmenes. Por eso tienes la seguridad que tienes un resumen actual y confiable. Así llegas a la conclusión rapidamente!

Preguntas frecuentes

What do I get when I buy this document?

You get a PDF, available immediately after your purchase. The purchased document is accessible anytime, anywhere and indefinitely through your profile.

100% de satisfacción garantizada: ¿Cómo funciona?

Nuestra garantía de satisfacción le asegura que siempre encontrará un documento de estudio a tu medida. Tu rellenas un formulario y nuestro equipo de atención al cliente se encarga del resto.

Who am I buying this summary from?

Stuvia is a marketplace, so you are not buying this document from us, but from seller nmn82. Stuvia facilitates payment to the seller.

Will I be stuck with a subscription?

No, you only buy this summary for 8,40 €. You're not tied to anything after your purchase.

Can Stuvia be trusted?

4.6 stars on Google & Trustpilot (+1000 reviews)

45,681 summaries were sold in the last 30 days

Founded in 2010, the go-to place to buy summaries for 15 years now

Empieza a vender

Vistos recientemente


8,40 €  9x  vendido
  • (0)
Añadir al carrito
Añadido