100% de satisfacción garantizada Inmediatamente disponible después del pago Tanto en línea como en PDF No estas atado a nada
logo-home
MAC2601 STUDY NOTES. 2,72 €
Añadir al carrito

Examen

MAC2601 STUDY NOTES.

 0 veces vendidas
  • Grado
  • Institución

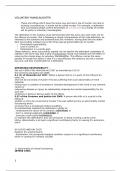
MAC2601 STUDY NOTES. Study Guide One Part 1 : Valuing inventories using basic techniques Topic 1 : Nature and behaviour of costs Study Unit 1 : Cost objects, classification and behaviour  Cost objects and traceability :  Cost object: is any activity, unit or phenomenon for which cost ca...

[Mostrar más]
Vista previa 4 fuera de 42  páginas

  • 1 de octubre de 2022
  • 42
  • 2022/2023
  • Examen
  • Preguntas y respuestas
avatar-seller
MAC2601 STUDY NOTES.

,Study Guide One
Part 1 : Valuing inventories using basic techniques
Topic 1 : Nature and behaviour of costs
Study Unit 1 : Cost objects, classification and behaviour

 Cost objects and traceability :
 Cost object: is any activity, unit or phenomenon for which cost can be accumulated
and measured.
 Direct cost: can be traced easily or physically to a particular cost object.
 Indirect cost: cannot be traced easily or physically to a particular cost object.
 Classification of costs according to their nature of origin :
 Manufacturing cost: factory costs; production costs
 Non-manufacturing cost: Marketing costs; Administration costs
 Further classification of manufacturing costs according to its components :
 Direct materials
 Direct labour
 Manufacturing overheads:
 Indirect materials
 Indirect labour
 Other manufacturing costs (rent, depreciation, electricity etc)
 Prime cost: total of all the direct material.
 Conversion cost: total cost when converting new material into finished products.
 Figure 1.1: The relationship between the components of manufacturing cost: Page 9
 Classification of costs according to cost behaviour :
 Fixed cost: cost that remains constant, in total, regardless of changes in the level of
activity or volume.
 Variable cost: cost that varies, in total, in direct proportion to changes in the level of
activity or volume.
 Semi-variable cost: contains both fixed and variable cost.
 Semi-fixed (stepped) cost: certain kinds of fixed costs increase or decrease only in
fixed increments or in steps.
 A closer look at relevant range and specific time frame :
 Relevant range: defined by the production capacity within which the organisation
normally operates.
 Specific time frame:
 In the very short term (eg in the next month), almost all cost (excluding
direct material) is fixed.
 In the short term (eg the next year), most of the fixed cost will remain fixed
monetary terms.
 In the medium term (two to three years), significant changes in the level of
fixed cost can be implemented.
 In the long term, all cost becomes variable.
 Classification of cost as product or period cost :
 Product (manufacturing) cost: cost incurred in the manufacturing of a product.
 Period (expenses) costs: costs that are not included in production costs.

,Study Unit 2 : Estimation techniques and the linear equation

 The linear equation :
 Cost equation based on linear equation : y = a + b x
 y = total cost; the dependent variable
 a = total fixed costs; the intercept on the y-axis
 b = variable cost per unit of activity; the slope of the straight line
 x = activity level; the independent variable
 Figure 2.1: Total cost graph: Page 21
 The high-low method :
 Variable cost per unit (High-low method):
𝑡ℎ𝑒 𝑑𝑖𝑓𝑓𝑒𝑟𝑒𝑛𝑐𝑒 𝑏𝑒𝑡𝑤𝑒𝑒𝑛 𝑐𝑜𝑠𝑡𝑠 𝑎𝑡 𝑡ℎ𝑒 ℎ𝑖𝑔ℎ𝑒𝑠𝑡 𝑎𝑛𝑑 𝑙𝑜𝑤𝑒𝑠𝑡 𝑎𝑐𝑡𝑖𝑣𝑖𝑡𝑦
𝑡ℎ𝑒 𝑑𝑖𝑓𝑓𝑒𝑟𝑒𝑛𝑐𝑒 𝑏𝑒𝑡𝑤𝑒𝑒𝑛 ℎ𝑖𝑔ℎ𝑒𝑠𝑡 𝑎𝑛𝑑 𝑙𝑜𝑤𝑒𝑠𝑡 𝑎𝑐𝑡𝑖𝑣𝑖𝑡𝑦
 Fixed costs: total fixed costs for related activity level – (variable cost per unit x related activity level)
 The scatter diagram :
 Formula : y = a + b x
 The fixed cost (a) is equal to the intercept on the y-axis.
 The variable cost (b) is computed by taking two points on the y-axis and x-axis and
calculating the difference per unit of activity in the same way as the high-low
method.
 Simple regression analysis (least squares method) :
 The linear equation can be used to determine the fixed and variable portions of
manufacturing overheads.
 Simple regression can be used to determine the relationship between the
dependent and independent variable.
 The values for “a” and “b” can be found by simultaneously solving the following
equation:
∑xy = a∑x + b∑x2……………………………..①
∑y = an + b∑x…………………………………..②

, Study Unit 3 : Cost-volume-profit analysis

 What is the cost-volume-profit analysis?
 It investigates the change in profit that results from changes in:
 Activity levels (units produced and sold)
 Per unit selling price
 Per unit variable costs
 Total fixed costs
 It is a powerful tool that management uses for short-term decision-making and
planning to investigate the impact of decisions on profit.
 Assumptions of the cost-volume-profit analysis :
 The selling price per unit is constant, irrespective of the sales volume.
 All costs are linear and can be accurately divided into variable and fixed elements.
 Variable costs are constant per unit; fixed costs are constant in total over the
relevant range.
 The sales mix is constant in multiproduct organisations.
 Inventory levels do not change, units sold is equal to units produced.
 Cost-volume-profit analysis applies to the relevant range only.
 Relevant range: upper and lower levels of production (= sales) activity levels.
 Contribution :
 The amount remaining after the deduction of all variable cost from sales.
 Contribution = sales – total variable costs
𝑐𝑜𝑛𝑡𝑟𝑖𝑏𝑢𝑡𝑖𝑜𝑛
 Contribution ratio = × 100%
𝑠𝑎𝑙𝑒𝑠
 Breakeven analysis :
 Breakeven point: point where the total contribution is equal to total fixed costs
(point where profit is zero).
 y = bx – a :
 y = net profit
 b = contribution per unit
 x = number of units sold
 a = total fixed cost
𝑡𝑜𝑡𝑎𝑙 𝑓𝑖𝑥𝑒𝑑 𝑐𝑜𝑠𝑡
 Breakeven point in units: 𝑐𝑜𝑛𝑡𝑟𝑖𝑏𝑢𝑡𝑖𝑜𝑛 𝑝𝑒𝑟 𝑢𝑛𝑖𝑡
 Breakeven value = breakeven units x selling price per unit
Or
𝑡𝑜𝑡𝑎𝑙 𝑓𝑖𝑥𝑒𝑑 𝑐𝑜𝑠𝑡𝑠
 Breakeven value = 𝑐𝑜𝑛𝑡𝑟𝑖𝑏𝑢𝑡𝑖𝑜𝑛 𝑟𝑎𝑡𝑖𝑜
 The effects of price and cost changes on the breakeven point :
 Activity 3.4: Pages 39 – 42
 Margin of safety :
 Margin of safety = total sales – breakeven sales
𝑚𝑎𝑟𝑔𝑖𝑛 𝑜𝑓 𝑠𝑎𝑓𝑒𝑡𝑦
 Margin of safety ratio % = 𝑡𝑜𝑡𝑎𝑙 𝑠𝑎𝑙𝑒𝑠
× 100%
 Target profit analysis :
𝑓𝑖𝑥𝑒𝑑 𝑐𝑜𝑠𝑡𝑠+𝑒𝑥𝑝𝑒𝑐𝑡𝑒𝑑 𝑝𝑟𝑜𝑓𝑖𝑡
 Sales units = 𝑐𝑜𝑛𝑡𝑟𝑖𝑏𝑢𝑡𝑖𝑜𝑛 𝑝𝑒𝑟 𝑢𝑛𝑖𝑡
𝑓𝑖𝑥𝑒𝑑 𝑐𝑜𝑠𝑡𝑠+𝑒𝑥𝑝𝑒𝑐𝑡𝑒𝑑 𝑝𝑟𝑜𝑓𝑖𝑡
 Sales value = 𝑐𝑜𝑛𝑡𝑟𝑖𝑏𝑢𝑡𝑖𝑜𝑛 𝑟𝑎𝑡𝑖𝑜
 Breakeven graph :
 Figure 3.1: Page 45

Los beneficios de comprar resúmenes en Stuvia estan en línea:

Garantiza la calidad de los comentarios

Garantiza la calidad de los comentarios

Compradores de Stuvia evaluaron más de 700.000 resúmenes. Así estas seguro que compras los mejores documentos!

Compra fácil y rápido

Compra fácil y rápido

Puedes pagar rápidamente y en una vez con iDeal, tarjeta de crédito o con tu crédito de Stuvia. Sin tener que hacerte miembro.

Enfócate en lo más importante

Enfócate en lo más importante

Tus compañeros escriben los resúmenes. Por eso tienes la seguridad que tienes un resumen actual y confiable. Así llegas a la conclusión rapidamente!

Preguntas frecuentes

What do I get when I buy this document?

You get a PDF, available immediately after your purchase. The purchased document is accessible anytime, anywhere and indefinitely through your profile.

100% de satisfacción garantizada: ¿Cómo funciona?

Nuestra garantía de satisfacción le asegura que siempre encontrará un documento de estudio a tu medida. Tu rellenas un formulario y nuestro equipo de atención al cliente se encarga del resto.

Who am I buying this summary from?

Stuvia is a marketplace, so you are not buying this document from us, but from seller ExellentStudyResources. Stuvia facilitates payment to the seller.

Will I be stuck with a subscription?

No, you only buy this summary for 2,72 €. You're not tied to anything after your purchase.

Can Stuvia be trusted?

4.6 stars on Google & Trustpilot (+1000 reviews)

45,681 summaries were sold in the last 30 days

Founded in 2010, the go-to place to buy summaries for 15 years now

Empieza a vender

Vistos recientemente


2,72 €
  • (0)
Añadir al carrito
Añadido