Practical 1
ASSIGNMENT 2 DESCRIPTIVE STAT
The data file contains data about a study on - you guessed it - stress.
More precisely, it contains data on the following variables:
STRESS: Indicates the source of stress, if the participant experiences stress
SMOKE: Indicates if the participant smokes
RELATION: Indicates if the participant is involved in a long-term romantic relationship
OPTIM: Measures how optimistic the participant is on a scale of 0 to 50
SATIS: Measures the life satisfaction of the participant on a scale of 0 to 50
NEGEMO: Measures the amount of negative emotions the participant experiences on a
scale of 0 to 50
Name: Short variable name
● Label: Variable name as displayed in output
● Values: The meaning of the values
● Measure: The level of measurement
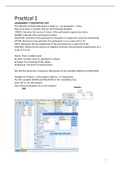
We will first generate a frequency distribution of the variables SMOKE and RELATION.
Navigate to Analyze → Descriptive Statistics → Frequencies.
Put the variables SMOKE and RELATION in the 'variable(s)' box.
Click 'Ok' to run the analysis.
How many participants are in the sample?
780
1
,Question 2: 51.9% of the people in this sample is a smoker.
Question 3: 47.9% of the people in this sample is in a relationship.
We will now create a histogram of the variable SATIS.
Navigate to Graphs → Legacy Dialogs → Histogram
Make sure to check the box 'Display Normal Curve'.
Click 'Ok' to run the analysis.
The output will now show you a histogram with a superimposed normal curve (i.e. the line
on the histogram).
Can we conclude that the data is normally distributed? YES
Question 4: We could say the data in this histogram are normally distributed, because the
histogram follows the normal curve (the line in the graph) pretty well.
Question 5:
Estimated mean: 26.81 Estimated SD: 6.99
2
,Next up is to generate a table with descriptive statistics.
Navigate to Analyze → Descriptive Statistics → Descriptives
Add the variable SATIS and OPTIM to the 'Variable(s)' box.
Click on “Options” and check the box “Variance”.
Click 'Ok' to run the analysis.
3
, Besides getting an overall impression of the data, another reason to look at the descriptive
statistics is to see if there are any errors in the data file, such as answers that are outside
the range of expected values.
To find these, you can sort the data file by a variable.
Navigate to Data → Sort Cases
Put the variable OPTIM in the 'Sort by' box.
If you find a strange value, you may select the whole row and delete it.
How many cases did you delete?
OPTIM: Measures how optimistic the participant is on a scale of 0 to 50
SORT CASES BY OPTIM(D).
You should have to delete 1 case, because it has a value for optimism that’s way out of the
range of this variable.
4
Los beneficios de comprar resúmenes en Stuvia estan en línea:
Garantiza la calidad de los comentarios
Compradores de Stuvia evaluaron más de 700.000 resúmenes. Así estas seguro que compras los mejores documentos!
Compra fácil y rápido
Puedes pagar rápidamente y en una vez con iDeal, tarjeta de crédito o con tu crédito de Stuvia. Sin tener que hacerte miembro.
Enfócate en lo más importante
Tus compañeros escriben los resúmenes. Por eso tienes la seguridad que tienes un resumen actual y confiable.
Así llegas a la conclusión rapidamente!
Preguntas frecuentes
What do I get when I buy this document?
You get a PDF, available immediately after your purchase. The purchased document is accessible anytime, anywhere and indefinitely through your profile.
100% de satisfacción garantizada: ¿Cómo funciona?
Nuestra garantía de satisfacción le asegura que siempre encontrará un documento de estudio a tu medida. Tu rellenas un formulario y nuestro equipo de atención al cliente se encarga del resto.
Who am I buying this summary from?
Stuvia is a marketplace, so you are not buying this document from us, but from seller Emma1512. Stuvia facilitates payment to the seller.
Will I be stuck with a subscription?
No, you only buy this summary for 9,49 €. You're not tied to anything after your purchase.