This is a summary for the course Experimental Research Methods. I included both pictures and SPSS snippets in the summary to make it more clear. I received an 8 in this course using this summary and practising with the tutorial assignments.
• Interpret a frequency distribution
Descriptive statistics = summarizing data (data = numerical information about a population or
sample)
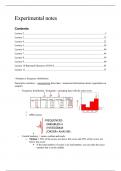
- Frequency distribution / histogram = grouping data with the same score
o
o SPSS syntax:
- Central tendency = mean, median and mode
o Median = 50% of the scores are above this score and 50% of the scores are
below this score
If the total number of scores is an odd number, you can take the exact
number that is in the middle
, If the total number of scores is an equal number, you identify the 2
scores that are in the middle of the list and then divide then take the
average of these two numbers
o Mean = sum of all scores divided by the number of scores
o Mode = score that you come across the most often
- Dispersion = how much do scores deviate from the most characteristic score (mean,
median or mode) = variance and standard deviation
o Variance =
o Standard deviation =
Inferential statistics = making inferences about a population, based on a sample > 3
procedures we can use:
1. Hypothesis testing: test whether the mean of the population is equal to a certain value
or not > hypotheses are exclusive and exhaustive
a. Can be one-sided or two-sided: you test if you can reject H0.
i.
ii.
b. Steps in hypothesis testing (one-sample t test, two-sided hypothesis)
i. Formulate hypotheses
1.
a. Here, 2.5 refers to the number you put in the hypothesis
ii. Determine decision rules to decide when a result is significant (alpha
level)
iii. Determine p-value based on SPSS output
1.
iv. Decision on significance and conclusion
1. If the p-value is lower than the alpha level you have previously
set, you reject H0
2. If the p-value is larger than the alpha level, you cannot reject
H0
, c. Note: you assume the sample is random sample: all cases have an equal
chance to be sampled, cases are selected independently of one another
d. Note: SPSS output always shows the p-value when doing a two-sided test so if
you want to test a one-sided hypothesis, there is an extra step you have to do:
i.
2. Point estimation
a. Answers the question: what is the best guess of this parameter? = which values
lie closest to the population value
i. For the population mean µ, the best guess is the sample mean
ii. For the population variance, the best guess is the sample variance
3. Interval estimation
a. Answers the question: what is the interval in which the value of the parameter
lies with … % confidence? > e.g. in 95% of the times I draw a sample of N =
50, the confidence interval will contain µ
b. Formula:
c. SPSS output:
i.
, 1. So, the test value here is t = 2.5
d. Testing two-sided hypotheses
i. If the confidence interval does not include the value used in your null-
hypothesis (e.g. 2.5), then you reject the hypothesis
ii. If the value used in your null hypothesis does fall in within the interval,
then you cannot reject H0
“The CI95 gives all possible hypothetical values for μ that are not rejected by
the sample statistics (given α)”
Example independent t-test
- RQ: on average, do male and female students differ in their self-esteem?
o 1. Hypotheses: because the RQ says ‘differ’, it is a two-sided hypotheses
(there is not one direction in which the groups will differ) =
o 2. Set alpha level at a = 0.05
o 3. Determine p-value based on the SPSS output (two-steps!)
First step = Levene’s test which tests whether σ^2(females) =
σ^2(males) (population variance) > this test tells us whether we
have to look at the equal variances assumed or the equal
variances not assumed
o H0: σ^2(females) = σ^2(males)
o H1: σ^2(females) ≠ σ^2(males)
o P = 0.062 which is larger than 0.05 = not significant!
Then, we look at the row ‘equal variances assumed’ (so,
this test assumes that the population variance for the
females and the population variance for the males are
equal)
Then, we look further at the t-test in the correct row that
Levene’s test has determined. This shows p = 0.105 which is
bigger than 0.05 = not significant so you cannot reject H0 =
average self-esteem does not differ between male and female
students
- RQ: on average, are female students less introverted than male students?
o 1. Hypotheses: Because the RQ says ‘less introverted’, it is a one-sided
hypothesis
o 2. Set alpha level, a = 0.05
o 3. Determine P-value based on SPSS output
Los beneficios de comprar resúmenes en Stuvia estan en línea:
Garantiza la calidad de los comentarios
Compradores de Stuvia evaluaron más de 700.000 resúmenes. Así estas seguro que compras los mejores documentos!
Compra fácil y rápido
Puedes pagar rápidamente y en una vez con iDeal, tarjeta de crédito o con tu crédito de Stuvia. Sin tener que hacerte miembro.
Enfócate en lo más importante
Tus compañeros escriben los resúmenes. Por eso tienes la seguridad que tienes un resumen actual y confiable.
Así llegas a la conclusión rapidamente!
Preguntas frecuentes
What do I get when I buy this document?
You get a PDF, available immediately after your purchase. The purchased document is accessible anytime, anywhere and indefinitely through your profile.
100% de satisfacción garantizada: ¿Cómo funciona?
Nuestra garantía de satisfacción le asegura que siempre encontrará un documento de estudio a tu medida. Tu rellenas un formulario y nuestro equipo de atención al cliente se encarga del resto.
Who am I buying this summary from?
Stuvia is a marketplace, so you are not buying this document from us, but from seller esmeevanderlem. Stuvia facilitates payment to the seller.
Will I be stuck with a subscription?
No, you only buy this summary for 6,49 €. You're not tied to anything after your purchase.