Sport Performance Analysis
Lecture 1
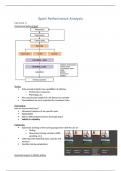
Internal and external load
Testing
Tests provide insights into capabilities of athletes:
o Performance measures
o Physiology, etc.
Also used to gain insight into risk factors for example
Preconditions are very important for consistent rules
Field testing
How to choose which test?
Movement patterns of the specific sport
Applicability
Able to differentiate between (training) status
Validity & reliability
Monitoring
Systematic tracking of the training programme with the use of:
o Testing
o Measuring training variables (sRPE,
sprinting, etc.)
Collecting data regarding load, capacity and
recovery
Possible training adaptations
Important aspect of athlete testing
, Protocol
o Reduce random noise
o Needs to be followed exactly!
Outcome measures
o How do they relate to actual performance?
Smallest worthwhile change
Smallest change between 2 separate test moments which is relevant
SWC must be greater than the standard error of the test
o SE is the measurement error of the test. I.e. even performing a test under the same
conditions multiple times leads to random errors
o Field testing usually have large SE
o SWC = 0.2 * standard deviation of your test population on a test
o Alternatively, SWC = coefficient of variation (CV)*2
More practical to obtain usually
Lecture 2 – Introduction (16/11)
Sport performance analysis creating a balance between load and recovery.
First, recovery was forgotten, but now it is becoming more important.
Psychological, physical and psychosocial factors influence the performance and health of an athlete.
External load = what you are doing, the load of training (kinetic energy)
Internal load = the load the person is experiencing, how you react to the external load (oxygen
uptake, perceived effort, joint load, muscle load)
Internal load can differ very much between persons. The external load is the same for
everyone.
,Lecture 3 - Data in Performance Analysis
Ways to monitor, explain, and enhance performance
Founding father football data analysis Charles Reep ruined English football by mathematical errors.
Why match (performance) analysis?
Improving decision making; providing data/information to be able to make better decisions.
1. Gold Standard: looking at the top; analysing the best/highest level to know the things you
have to do get better.
2. Team Analysis: what is my team doing, do they perform the things we did in training?
3. Opponent Analysis: What does the opponent do in preparation for a game to improve
chances of winning
4. Profiling: scouting, get ideas of specific players. If I have a specific system, how should my
midfielder look like?
5. Evaluation: do we actually do the things the way we trained it? How did we perform?
Why do we need data?
Franks & Miller, 1986; Eyewitness Testimony in Sport Coaches are able to recall 42% of important
game event
When we categorize actions up to 95%.
How can we get to the information / key actions in the game?
Process chain of systematic game analysis
Classic Model by Winkler (1985)
Generate / Measure Analysis Presentation/Interpretation
Extension according to Pfeiffer, 2002
Category-Design; Generate / Measure Analysis Presentation/Interpretation
1) Examination plan (Who? What? For what? What is possible?)
2) Only what I measure can I evaluate!
3) Exact definition of the items!
How would you define the items (discussed in smaller groups during the lecture):
1. Shoot on goal: When a player kicks or shoots the ball towards the opponent’s goal and does
an attempt to make a goal.
2. Pass: the attempt to kick the ball to a teammate, transporting the ball.
3. Tackling: trying to stop the opponent who has the ball, get possession of the ball, making a
slide on the ball.
Definition:
1. Shoot on goal:
a. Is defined as any goal attempt that:
Goes into the net regardless of intent
Is a clear attempt to score that would have gone into the net but for being
saved by the goalkeeper or is stopped by a player who is the last-man with
the goalkeeper having no chance of preventing the goal
2. Pass
a. Is an action of controlled displacement of the ball, where the intention can be seen
to play the ball specifically to a teammate
3. Tackling
a. Is defined as where a player connects with the ball in a ground challenge where he
successfully takes the ball away from the player in possession.
, Simple words can make a difference in a definition.
You need to think up front what you want to measure and how you categorize to get the right
data/information.
Qualitative vs. Quantitative
Qualitative Quantitative
Subjective Objective (no bias)
Opinion oriented Fact oriented
Judgement Measurement
Use of Expertise & knowledge Use of detailed instructions/structure
Interpretation Statistic analysis
Flexible process structure Fixed process (a clear protocol)
Examples: Examples:
The positions a player could play; the More numbers: numbers of passes,
capabilities assists
Strengths & Weaknesses Qualitative Data:
Strengths:
Use of the knowledge and expertise of expert observers
Mostly low costs – immediately available (you can give immediate feedback, in a game you
can roll back a video clip for example)
Weaknesses:
Limited capacity of attention and memory (you might miss out some of the factors, the way
you can report or give feedback can be done in a lot of different ways)
Personal bias, emotions and subjective interpretations
Strengths & Weaknesses Quantitative Data:
Strengths:
No bias, subjective influence of the measured variables
Comparable measured variables with concrete numerical values
Weaknesses:
Often time and cost intensive (you need more people to analyse the date for example)
Interpretation detached from context (what does it mean if a player has 20 shots on goal, was
it very easy to reach the goal or was there a very difficult situation? Context can be key and
that is often missing with quantitative data)
Current solution: combine qualitative and quantitative data notation analysis
Improved objectivity through categorization
Quantification of events
Possibilities of qualitative characteristics
How do I use the data correctly?
Categorical data
Frequencies of Qualitative Characteristics
Discrete data (pregnant – not pregnant principle)
Benefits as continuous data possible (large examples)
Nominal data (not groupable) or Ordinary data (groupable)
Los beneficios de comprar resúmenes en Stuvia estan en línea:
Garantiza la calidad de los comentarios
Compradores de Stuvia evaluaron más de 700.000 resúmenes. Así estas seguro que compras los mejores documentos!
Compra fácil y rápido
Puedes pagar rápidamente y en una vez con iDeal, tarjeta de crédito o con tu crédito de Stuvia. Sin tener que hacerte miembro.
Enfócate en lo más importante
Tus compañeros escriben los resúmenes. Por eso tienes la seguridad que tienes un resumen actual y confiable.
Así llegas a la conclusión rapidamente!
Preguntas frecuentes
What do I get when I buy this document?
You get a PDF, available immediately after your purchase. The purchased document is accessible anytime, anywhere and indefinitely through your profile.
100% de satisfacción garantizada: ¿Cómo funciona?
Nuestra garantía de satisfacción le asegura que siempre encontrará un documento de estudio a tu medida. Tu rellenas un formulario y nuestro equipo de atención al cliente se encarga del resto.
Who am I buying this summary from?
Stuvia is a marketplace, so you are not buying this document from us, but from seller lynnverver. Stuvia facilitates payment to the seller.
Will I be stuck with a subscription?
No, you only buy this summary for 4,98 €. You're not tied to anything after your purchase.