Bedrijfskunde , Marketing , International Business and Management
Supply Chain minor
Todos documentos para esta materia (1)
Vendedor
Seguir
trangphan
Vista previa del contenido
Chapter 7 Z-TRANSFORMATIONS & DISTRIBUTIONS EXAM
QUESTION 1
1. A generator produces an average power of 50 megawatts with a standard deviation of 4.1
megawatts. Assume that the population data is normally distributed.
What percentage of generators have a capacity of less than 45 megawatts?
87,8
%
11,1
%
12,2
%
88,9
%
10 points
QUESTION 2
1. A quality engineer monitors the pigment concentration when manufacturing plastic products. You can
assume that the data is normally distributed. The product is approved if the pigment value is
between 12 and 8.
He measures the concentration of the pigment from 35 consecutive batches.
The data can be found here: Pigment.xlsx
What is the expected percentage of rejected products in the population ?
If your answer is 7.45%, enter 7.5 without a percent sign.
10 points
QUESTION 3
1. What percentage of the data falls between –3 and +3 standard deviation from the mean for a normal
distribution according to the empirical rule?
68,26
%
95,44
%
99,74
%
50%
10 points
QUESTION 4
1. The following data contains the scores on a sigma course of 8 participants: 85, 72, 94, 85, 95, 94, 85,
76. Which statement is NOT true!
The mode is 85
The average is
85.75
The median is 85
De range is 8
, 10 points
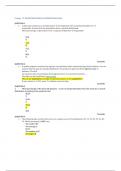
QUESTION 5
1. Which of the following statements about the cumulative distribution function below is true?
15% of the population is smaller than 70.2
19.8% of the population is between 15 and
16.5
70.2% of the population is over 15
90% of the population is exactly equal to 16.5
10 points
QUESTION 6
1. Which statements about stochastic distributions are true?
Multiple options may be correct.
Anderson-Darling is a method to test whether data are normally distributed.
The cumulative distribution function (CDF) represents an area under the probability density
function.
The probability density function represents the best-fitting normal distribution for a given
histogram.
A normal quantile plot (or QQ plot) shows in concrete terms how well the data is normally
distributed.
10 points
QUESTION 7
What's going on with the Normal Quantile Plot below?
Abnormally high standard deviation
There may be two or more outliers
Two or more missing data
Uniform distribution
Long wide ends (tails) at both left and right of the corresponding normality plot.
10 points
QUESTION 8
1. Suppose you work as a lean six sigma green belt in a hospital and investigate the number of patient
days during a certain operation.
The corresponding dataset can be found here: Hospital stay.xlsx
Note that the length of stay is expressed in the number of days.
The first step is to investigate whether the data is normally distributed.
Which of the statements below is correct?
The data contains deviating patterns for the length of stay of 6 days and approximately 17 days.
The data is not normally distributed.
Data is not normally but uniformly distributed
Although the data contains abnormal patterns, the distribution of the data can be considered
normal.
The data is normally distributed. No special patterns can be discovered in the data.
The data contains abnormal patterns for lengths of stay of 6 days and more than 17 days.
The data is not normally distributed.
10 points
Los beneficios de comprar resúmenes en Stuvia estan en línea:
Garantiza la calidad de los comentarios
Compradores de Stuvia evaluaron más de 700.000 resúmenes. Así estas seguro que compras los mejores documentos!
Compra fácil y rápido
Puedes pagar rápidamente y en una vez con iDeal, tarjeta de crédito o con tu crédito de Stuvia. Sin tener que hacerte miembro.
Enfócate en lo más importante
Tus compañeros escriben los resúmenes. Por eso tienes la seguridad que tienes un resumen actual y confiable.
Así llegas a la conclusión rapidamente!
Preguntas frecuentes
What do I get when I buy this document?
You get a PDF, available immediately after your purchase. The purchased document is accessible anytime, anywhere and indefinitely through your profile.
100% de satisfacción garantizada: ¿Cómo funciona?
Nuestra garantía de satisfacción le asegura que siempre encontrará un documento de estudio a tu medida. Tu rellenas un formulario y nuestro equipo de atención al cliente se encarga del resto.
Who am I buying this summary from?
Stuvia is a marketplace, so you are not buying this document from us, but from seller trangphan. Stuvia facilitates payment to the seller.
Will I be stuck with a subscription?
No, you only buy this summary for 6,49 €. You're not tied to anything after your purchase.