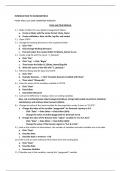
This documents give a brief yet deep basic understanding in using Stata as a statistical programming application. With Stata, you could do some research, forecasting, analyzing, etc. that uses basic principal of statistics. Stata is widely use on research purposes. This practice questions is used a...
Test Bank For Introductory Econometrics: A Modern Approach 7th Edition By Jeffrey M. Wooldridge
ECON0019 (Quantitative Economics and Econometrics) Term 2 Summary - UCL Economics BSc Second Year
ECON0019 (Quantitative Economics and Econometrics) Term 1 Summary - UCL Economics BSc Second Year
Todos para este libro de texto (13)
Escuela, estudio y materia
Padjadjaran University
Economics
Introductory of Econometrics with Stata
Todos documentos para esta materia (1)
Vendedor
Seguir
nicholasrds
Vista previa del contenido
INTRODUCTION TO ECONOMETRICS
POINT AND CLICK DAN COMMAND WINDOW
Point and Click Method.
1.) Make 4 folders for your global management folders
a. Create a folder with the name format: Stata_Name
b. Create subfolders: data, do-file, log-file, and output
2.) Open STATA
3.) Change the working directory to the respective folder
a. Click "File"
b. Click Change Working Directory
c. Find and select the created folder (C:\(Stata_Name) to use
4.) Create a log file with the name "1_StataLab"
a. Click "File"
b. Click "Log" -> Click "Begin"
c. Then locate the folder (C:\(Stata_Name)\log-file
d. Write the name of the dile with "1_StataLab "
5.) Retrieve lifeexp.dta file data into STATA
a. Click "Flie"
b. Example datasets.. -> Click "Example datasets installed with Stata"
c. Then select "lifeexp.dta"
6.) View the values of the variables available in STATA
a. Click "Data"
b. Data Editor
c. Data Editor (Browse)
7.) Look at the difference in display colors on existing variables
blue, red, and black)/value label (categorical) (blue), string (red) (unable to perform statistical
calculations), and ordinary data (numeric) (black)
8.) Change the value of the island variable for the population under 5 years to "33,572"
a. Change the value of the variable "popgrowth" for Denmark country to 0.4
- Click "Data" -> Data Editor -> Data Editor (Edit)
- Change the value of varibel popgrowth for Denmark to 0.4
b. Change the value of the Russian state "region" variable to "Eur & C.Asia"
- Click "Data" -> Data Editor -> Data Editor (Edit)
- Change the value of the Russian region to "Eur & C.Asia"
9.) Look at the number of observations, the number of variables and what variables are in the data
a. Click "Data"
b. Describe Data
c. Describe data in memory -> OK
10.) Take a look at some statistical information from the existing data
a. Click "Data"
b. Describe Data
c. Summary Statistics
11.) Tabulate one of the variables, namely the "popgrowth" variable
Los beneficios de comprar resúmenes en Stuvia estan en línea:
Garantiza la calidad de los comentarios
Compradores de Stuvia evaluaron más de 700.000 resúmenes. Así estas seguro que compras los mejores documentos!
Compra fácil y rápido
Puedes pagar rápidamente y en una vez con iDeal, tarjeta de crédito o con tu crédito de Stuvia. Sin tener que hacerte miembro.
Enfócate en lo más importante
Tus compañeros escriben los resúmenes. Por eso tienes la seguridad que tienes un resumen actual y confiable.
Así llegas a la conclusión rapidamente!
Preguntas frecuentes
What do I get when I buy this document?
You get a PDF, available immediately after your purchase. The purchased document is accessible anytime, anywhere and indefinitely through your profile.
100% de satisfacción garantizada: ¿Cómo funciona?
Nuestra garantía de satisfacción le asegura que siempre encontrará un documento de estudio a tu medida. Tu rellenas un formulario y nuestro equipo de atención al cliente se encarga del resto.
Who am I buying this summary from?
Stuvia is a marketplace, so you are not buying this document from us, but from seller nicholasrds. Stuvia facilitates payment to the seller.
Will I be stuck with a subscription?
No, you only buy this summary for 0,00 €. You're not tied to anything after your purchase.