4.2.1 THE MEASUREMENT OF MACROECONOMIC PERFORMANCE
Macroeconomics is the study of the economy as a whole.
Macroeconomic objectives:
- Trade (equilibrium of balance of payments on the current account)
- Inflation (low and stable inflation)
- Growth (stable economic growth)
- Employment (low unemployment)
- Redistribution of income (lower income inequality)
- Sustainability (environment)
- (Balance fiscal budget, gov. spending = tax)
Macroeconomic conflicts - the balance of one objective might lead to the unbalance of another
one.
· Economic growth vs inflation
When the economy is growing really quickly, firms have difficulty employing sufficient skills. Might
be because; not enough skilled workers to fill all the job openings, skill mismatch, education and
training systems might not be able to keep up with this rapid changes in demand as it takes time
to develop skills.
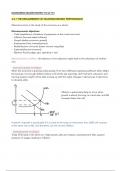
Inflation is particularly likely to occur when
growth is above the long run trend rate, and AD
increases faster than AS.
However, if growth is sustainable (if it is close to the long run trend rate), then LRAS will increase
at the same rate as AD, and therefore, we will not see inflation.
· Unemployment vs inflation
Trade off at least in the short-run. High growth, jobs are created, unemployment falls, upward
pressure on wages, leading to inflation.
,A cut in interest rates leads to higher AD, leading to higher growth, lower unemployment but also
higher inflation.
However, it is possible to reduce booth if successful supply-side policies are used. You can reduce
structural unemployment without causing wage inflation. Also, if growth is sustainable, inflation
will remain low.
· Economic growth vs environmental protection
Higher GDP, higher levels of pollution and consumption of non-renewable resources.
However, it is possible to have economic growth without harming the environment. Eg. The
development of solar panels has helped increase energy productivity, but it is also better for the
environment than for example burning coal.
· Inflation vs balance of payments
Domestic inflation stimulates import spending as they are relatively cheaper and exports appear
more expensive abroad.
Macroeconomic indicators:
- Real GDP: quantity of goods and services produced in an economy (national output). Value of
GDP adjusted for inflation.
- Real GDP per capita: average output per person in an economy
National income can also be measured by:
· Gross National Product (GNP): market value of all products produced in an annum by the labour
and property supplied by the citizens of one country. GDP + income earned from overseas assets
income earned by overseas residents
· Gross National Income (GNI): sum of value added by all producers who reside in a nation +
product taxes ( - subsidies) not included in the value of output + receipts of primary income from
abroad
- Consumer Prices Index and Retail Prices Index (CPI/RPI): measurements of inflation. CPI
measures the household purchasing power with the Family Expenditure Survey. This finds out
what consumers spend their income on. A basket of goods is created and the goods are
, weighted according to how much income is spent on each item. RPI includes housing costs,
such as payments on mortgage interest and council tax. This is why RPI tends to have a higher
value.
Measures of unemployment:
- The Claimant Count: counts the number of people claiming unemployment related benefits,
such as Job Seeker’s Allowance (JSA). They have to prove they are actively looking for work.
- The International Labour Organisation (ILO) and the UK Labour Force Survey (LFS) which is
taken by the ILO. Directly asks people if they meet the following criteria: been out of work for 4
weeks, able and willing to start working within 2 weeks, workers should be available for 1 hour
per week.
Part time unemployment is included. Since part-time unemployed are less likely to claim
unemployment benefits, this method gives a higher unemployment figure.
Measures of productivity:
Measured by output per worker per period of time. Measures how efficient production is.
Balance of payments on current account:
Record of all financial transactions made between consumers, firms and the government from one
country with other countries. It states how much is spent on imports, and what the value of
exports is.
The balance of payments is made up of:
- The current account (balance of trade in goods and services)
- The capital account
- The official financing account
Uses of index numbers
Frequently used to illustrate economic variables when data is presented.
Useful when making comparisons over periods of time. Particularly useful when it is the size of
changes in variables that need to be highlighted.
New Price
——————— x 100
Base year price
Uses of national income data
Real GDP shows what GDP can ‘buy’ after adjusting for change in prices over time. Frequently
used to assess the standard of living enjoyed by a country’s population. To use GDP to measure
living standards it would be appropriate to use GDO over capita for an economy to see how ‘well
off’ individuals are.
, A higher GDP per capita, means individuals are able to buy more goods and services, increasing
the population’s standard of living compared with that of. a population with a lower real GDP per
capita.
Main uses of national income data:
- Determine economic growth
- Estimate likely tax revenues
- Estimate likely welfare expenditure (such as unemployment benefits)
- Assess inflationary pressure (if national income is found to be rising rapidly)
Limitations of national income:
- Distribution of income (greater income inequality makes GDP per capita less reliable in
measuring the country’s living standards)
- Composition of GDP (how national income is generated matters, eg. Military expenditure could
be a very important contributor to GDP and will create some jobs but will not add much to the
general living standards)
- Shadow economy (income generated form unrecorded transactions. They add to the living
standards but don’t show in the official GDP data. Official GDP understates living standards.
UK’s shadow economy is worth around 10% of actual GDP)
- Non-marketed output (plenty of goods show up in official GDP data. Services such as DIY and
childcare can be obtained as paid-for services but are often conducted by families for free.
These will add to the family’s welfare without ever showing up in the official data)
- Negative externalities (additions to GDP often generate negative externalities which reduce
standards of living. Increases in GDP often exaggerate the improvements to people’s standards
of living by ignoring the negative aspects of these increases)
- Non-financial factors (there are plenty of other factors apart from income which add to people’s
general quality of life such as the quality of health provision, education provision, individual
freedoms, amount of leisure time enjoyed. All of these contribute to living standards but do not
directly appear in the GDP data)
Uses and limitations of national income data to compare differences in living standards between
countries:
- GDP doesn’t give an indication of the distribution of income so two countries with similar GDP’s
per capita may have different distributions which lead to different living standards
- GDP may need to be recalculated in terms of purchasing power, so that it can account for
international price differences. The purchasing power is determined by the cost of living in each
country, and the inflation rate
- Large hidden economies which are not accounted for in GDP. Can make GDP comparisons
misleading and difficult to compare
- GDP gives no indication of welfare
- Other measures such as the happiness index, might be used to compare living standards
instead or in conjunction with GDP
Los beneficios de comprar resúmenes en Stuvia estan en línea:
Garantiza la calidad de los comentarios
Compradores de Stuvia evaluaron más de 700.000 resúmenes. Así estas seguro que compras los mejores documentos!
Compra fácil y rápido
Puedes pagar rápidamente y en una vez con iDeal, tarjeta de crédito o con tu crédito de Stuvia. Sin tener que hacerte miembro.
Enfócate en lo más importante
Tus compañeros escriben los resúmenes. Por eso tienes la seguridad que tienes un resumen actual y confiable.
Así llegas a la conclusión rapidamente!
Preguntas frecuentes
What do I get when I buy this document?
You get a PDF, available immediately after your purchase. The purchased document is accessible anytime, anywhere and indefinitely through your profile.
100% de satisfacción garantizada: ¿Cómo funciona?
Nuestra garantía de satisfacción le asegura que siempre encontrará un documento de estudio a tu medida. Tu rellenas un formulario y nuestro equipo de atención al cliente se encarga del resto.
Who am I buying this summary from?
Stuvia is a marketplace, so you are not buying this document from us, but from seller ainaragsa. Stuvia facilitates payment to the seller.
Will I be stuck with a subscription?
No, you only buy this summary for 10,48 €. You're not tied to anything after your purchase.