Summary- Advanced Quantitative Research Methods (INFOQNM)
27 vistas 3 purchases
Grado
Advanced Quantitative Research Methods (INFOQNM)
Institución
Universiteit Utrecht (UU)
This document is a summary of all lectures and lecture notes, with extra notes, incuding clear figures and additional explanations of statistical tests and theories. It also includes the quizzes with answers (in the footnote) All you need for the exam :)
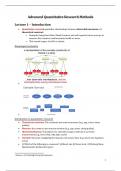
Lecture 1 – Introduction
• Quantitative research quantifies relationships between observable measures of a
theoretical construct
• Example: Using Heart Rate, Blood Pressure, and self-reported stress surveys to
measure the construct cardiovascular health or stress
• This sounds vague…but life is chaotic
Nomological networks
•
•
Introduction to quantitative research
• Theoretical construct: The construct you want to measure (e.g., age, stress, sleep
quality)
• Measure: the construct you want to measure (e.g., age, stress, sleep quality)
• Operationalisation: Translation of a somewhat vague construct to a precise
measurement (e.g., how, what, why, type, scale)
• Variable: Outcome of applying the measure, the actual ‘data’ (e.g., heart rate, hapiness
score)
• Q: Which of the following is a measure? (A)Heart rate b) Stress level c) Pittsburg Sleep
Questionnaire d) Question type)1
1 Answer: c) Pitssburgh Sleep Questionnaire
1
,Scales
• Nominal: Categorical variables where order makes no sense
o Type of transport, mood, breakfast
• Ordinal: Categorical variables where order makes (some) sense
o Income levels, pain intensity, (Likert scales)
• Interval: No natural zero value, but differences make sense
o The zero is a starting point, but it doesn't mean there's none of something; it's
more of a benchmark.
o Temperature, IQ scores, pH levels, (Likert scales)
• Ratio: Natural zero value. Ratios and differences make sense
o The zero means there's none of something, and you can also compare amounts
and see how many times one amount is bigger than another.
o Heart rate, respiration, blood pressure
• Q: I measure your level of attention using the duration (in seconds) you look at your
phone instead of me. What scale does my variable have?2
Variables
• Various types:
o Continuous: Can also have a value between two other values
o Discrete: Only distinct values are possible
• Various roles:
o Independent: Predictors; X; the ‘knobs’ used to explain
o Dependent: Outcome; Y; the observed variable to explain
Quality
• How precise are our measurements? (i.e., how reliable/consistent?)
• How accurate are our measurements? (i.e., how valid?)
• High reliability but low validity = bad (Headsize to measure intelligence)
• Low reliability but high validity = bad (Scale 0-10, how happy are you right now?)
• High reliability and high validity = good! (Balanced and validated questionnaire for sleep
quality, PSQI)
• Reliability (precise)
o Test-retest: If repeated later, do we get the same answer?
o Inter-rater: If repeated for someone else, do we get the same answer?
o Parallel forms: If repeated across theoretically equivalent but different
measurements, do we get the same answer?
o Internal consistency: Do the different parts of a questionnaire agree with each
other?
• Q: I measure my stress level using a self-reported survey with multiple questions. I do
this twice using different survey’s. What type(s) of reliability are assessed here?3
• Validity (accuracy)
o Many types
o Construct validity: To what extent do the measurements allow us to make
conclusions about the theoretical construct?
2 Ratio
3 Parallel forms and internal consistency
2
, ▪ High validity example: Continuous report of affect
▪ Low validity example: HR to estimate stress
o Ecological validity: To what extent do the conclusions generalize to real-world
situations?
▪ High validity example: TIHM dataset (recorded at home)
▪ Low validity example: CASE dataset (recorded in restricted lab setting)
• Threats to validity
o Confound: Additional unmeasured variable related to the predictors and
outcomes
o Artifact: Special situation during your study that limits generalizability
o Many types of confounds and artifacts…
o History effects: Specific (historic) events occured that influence outcomes
o Maturational effects: People age, getting bored, tired, etc…
o Repeated testing: People learn and practice, getting familiar
o Selection bias: Treatment and control group have different characteristics
o Non-response bias: People responding have more in common than random
o Experimenter bias: Asking specific questions, signaling desired behaviour
o Demand effects: The fact that people know they are part of an experiment can
influence their behavior or responses.
o Placebo effects: Control group shows effect
o Fraud, deception, self-deception, etc…: Researcher dishonesity
• Ultimate goal of good research design: Maximise validity and reliability by minimizing
threats.
3
, Lecture 2 – Parametric vs Non-Parametric tests (1/3)
Statistical inference
• You are a teacher at Hogwarts. You want to know what percentage of students can
perform a Patronus charm to adapt your lectures.
• You have a population.
• You have a parameter you want to know.
• You need to take a sample of Hogwarts students to estimate the variable.
• How do you know if the estimation for the parameter you get from the sample is
accurate for the whole population?
o → Statistical inference: infer properties (draw conclusions) from a sample
about the population
• Greek letters = population; normal alphabet = sample
Parametric vs non parametric tests
• Statistical tests: parametric or non-parametric?
• Parametric tests assume a specific distribution for the data of the population.
• Parametric tests are more powerful when these assumptions are met. Non-
parametric tests are more robust when these assumptions are violated.
4
Los beneficios de comprar resúmenes en Stuvia estan en línea:
Garantiza la calidad de los comentarios
Compradores de Stuvia evaluaron más de 700.000 resúmenes. Así estas seguro que compras los mejores documentos!
Compra fácil y rápido
Puedes pagar rápidamente y en una vez con iDeal, tarjeta de crédito o con tu crédito de Stuvia. Sin tener que hacerte miembro.
Enfócate en lo más importante
Tus compañeros escriben los resúmenes. Por eso tienes la seguridad que tienes un resumen actual y confiable.
Así llegas a la conclusión rapidamente!
Preguntas frecuentes
What do I get when I buy this document?
You get a PDF, available immediately after your purchase. The purchased document is accessible anytime, anywhere and indefinitely through your profile.
100% de satisfacción garantizada: ¿Cómo funciona?
Nuestra garantía de satisfacción le asegura que siempre encontrará un documento de estudio a tu medida. Tu rellenas un formulario y nuestro equipo de atención al cliente se encarga del resto.
Who am I buying this summary from?
Stuvia is a marketplace, so you are not buying this document from us, but from seller IsabelleU. Stuvia facilitates payment to the seller.
Will I be stuck with a subscription?
No, you only buy this summary for 7,66 €. You're not tied to anything after your purchase.