Summary of the book 'International Trade: Theory and Policy' by Krugman, Obstfeld and Melitz
Full Summary International Trade and Investment
Full Summary International Trade and Investment
Todos para este libro de texto (8)
Escuela, estudio y materia
Universiteit van Amsterdam (UvA)
Economie
International Trade and Investment
Todos documentos para esta materia (8)
Vendedor
Seguir
elinesteur
Comentarios recibidos
Vista previa del contenido
Chapter 6: The Standard Trade Model
Previous chapters developed several different models of international trade, each of which makes
different assumptions about the determinants of production possibilities.
The Ricardian model. Production possibilities are determined by the allocation of a single
resource, labor, between sectors. This model conveys the essential idea of comparative
advantage but does not allow us to talk about the distribution of income.
The specific factors model. This model includes multiple factors of production, but some are
specific to the sectors in which they are employed. It also captures the short-run
consequences of trade on the distribution of income
The Heckscher-Ohlin model. The multiple factors of production in this model can move
across sectors. Differences in resources (the availability of those factors at the country level)
drive trade patterns. This model also captures the long-run consequences of trade on the
distribution of income.
When we analyze real problems, we want to base our insights on a mixture of these models. In spite
of the differences in their details, our models share a number of features:
1. The productive capacity of an economy can be summarized by its production possibility
frontier, and differences in these frontiers give rise to trade.
2. Production possibilities determine a country’s relative supply schedule.
3. World equilibrium is determined by world relative demand and a world relative supply
schedule that lies between the national relative supply schedules.
Because of these common features, the models we have studied may be viewed as special cases of a
more general model of a trading world economy.
A Standard Model Of A Trading economy
The standard trade model is built on four key relationships: (1)the relationship between the
production possibility frontier and the relative supply curve; (2) the relationship between relative
prices and relative demand; (3) the determination of world equilibrium by world relative supply and
world relative demand; (4) the effect of the terms of trade – the price of a country’s export divided
by the price of its imports - on a nation’s welfare.
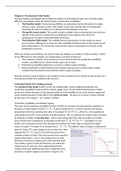
Production Possibilities and Relative Supply
The point on its production possibility frontier at which an economy actually produces depends on
the price of cloth relative to food, PC / P F. At given market prices, a market economy will choose
production levels that maximize the value of its output PC Q C + P F Q F, where Q C is the quantity of
cloth produced and Q F is the quantity of food produced. We can indicate the market value of output
by drawing a number of isovalue lines – that is, lines along which the value of output is constant.
Each of these lines is defined by an equation of the form PC Q C + P F Q F=V . The higher V is, the
farther out an isovalue line lies; thus isovalue lines farther from the origin correspond to higher
values of output. The slope of an isovalue line is −PC / P F. The highest value of output is achieved at
point Q , where TT is just tangent to an isovalue line. Now
suppose that PC / P F were to rise (cloth becomes more
valuable relative to food). Then the isovalue lines would be
steeper than before. A rise in the relative price of cloth
leads the economy to produce more cloth and less food.
The relative supply of cloth will therefore rise when the
relative price of cloth rise. This relationship between
relative prices and relative production is reflected in the
economy’s relative supply curve shown in Figure 6-2b.
,Relative Prices And Demand
The value of an economy’s consumption equals the value of its production:
PC Q C + P F Q F=PC D C + P F D F =V
Where D C and D F are the consumption of cloth and food, respectively. The equation above says
that production and consumption must lie on the same isovalue line. The economy’s choice of a
point on the isovalue line depends on the tastes of its consumers. For our standard model, we
assume the economy’s consumption decisions may be represented as if they were based on the
tastes of a single representative individual. The tastes of an individual can be represented graphically
by a series of indifference curves. An indifference curve traces a set of combinations of cloth (C) and
food (F) consumption that leave the individual equally well off. The indifference curves have three
properties:
1. They are downward sloping: If an individual is offered less food (F), then to be made equally
well off, she must be given more cloth (C).
2. The farther up and to the right an indifference curve lies, the higher level of welfare to which
it corresponds: An individual will prefer having more of both goods to less.
3. Each indifference curve gets flatter as we move to the right (they are bowed-out to the
origin): The more C and the less F an individual consumes, the more valuable a unit of F is at
the margin compared with a unit of C, so more C will have to be provided to compensate for
any further reduction in F.
As you can see in Figure 6-3, the economy will choose to consume at the point on the isovalue line
that yields the highest possible welfare. This point is where the isovalue line is tangent to the highest
reachable indifference curve, shown here as point D. Notice at this point, the economy exports cloth
and imports food. Now consider what happens when PC / P F increases. Figure 6-4a shows the
, effects. The economy produces more C and less F, shifting production from Q 1 to Q 2. This shifts; from
V V 1, to V V 2, the isovalue line on which consumption must lie. The economy’s consumption choice
therefore also shifts, from D 1 to D 2. This shift reflects two effects of the rise in PC / P F. First, the
economy has moved to a higher indifference curve, meaning that it is better off. The reason is that
this economy is an exporter of cloth. When the relative price of cloth rises, the economy can trade a
given amount of cloth for a larger amount of food imports. Thus the higher relative price of its export
good represents an advantage. Second, the change in relative prices leads to a shift along the
indifference curve, toward food and away from cloth (since cloth is now relatively more expensive).
These two effects are familiar form basic economic theory. The rise in welfare is an income effect;
the shift in consumption at any given of welfare is a substitution effect. The income effect tends to
increase consumption of both goods, while the substitution effect acts to make the economy
consumes less C and more F. Figure 6-4b shows the relative supply and demand curves associated
with the production possiiblities frontier and the indifference curves. The graph shows how the
increase in the relative price of cloth induces an increase in the relative production of cloth (move
from point 1 to 2) as well as a decrease in the relative consumption of cloth (move from point 1’ to
2’). This change in relative consumption captures the substitution effect of the price change. If the
income effect of the price change were large enough, then consumption levels of both goods could
rise ( D C and D F both increase); but the substitution effect of demand dictates that the relative
consumption of cloth, D C / D F decrease. If the economy cannot trade then it consumes and
produces at point 3.
The Welfare Effect Of Changes In Terms Of Trade
When PC / P F increases, a country that initially exports cloth is made better off, as illustrated by the
movement from D 1 to D2 in figure 6-4a. If the country were initially an exporter of food, the country
would be worse off: The relative price of the good it exports (food) would drop. We cover all these
cases by defining the terms of trade as the price of the good a country initially exports divided by the
price of the good it initially imports. The general statement, then, is that a rise in the terms of trade
increases a country’s welfare, while a decline in the terms of trade reduces its welfare. Note,
however, that changes in a country’s terms of trade can never decrease the country’s welfare below
its welfare level in the absence of trade.
Determining Relative Prices
Let’s now supposes that the world economy consists of two countries once again named Home
(which exports cloth) and Foreign (which exports food). Home’s terms of trade are measured by
Los beneficios de comprar resúmenes en Stuvia estan en línea:
Garantiza la calidad de los comentarios
Compradores de Stuvia evaluaron más de 700.000 resúmenes. Así estas seguro que compras los mejores documentos!
Compra fácil y rápido
Puedes pagar rápidamente y en una vez con iDeal, tarjeta de crédito o con tu crédito de Stuvia. Sin tener que hacerte miembro.
Enfócate en lo más importante
Tus compañeros escriben los resúmenes. Por eso tienes la seguridad que tienes un resumen actual y confiable.
Así llegas a la conclusión rapidamente!
Preguntas frecuentes
What do I get when I buy this document?
You get a PDF, available immediately after your purchase. The purchased document is accessible anytime, anywhere and indefinitely through your profile.
100% de satisfacción garantizada: ¿Cómo funciona?
Nuestra garantía de satisfacción le asegura que siempre encontrará un documento de estudio a tu medida. Tu rellenas un formulario y nuestro equipo de atención al cliente se encarga del resto.
Who am I buying this summary from?
Stuvia is a marketplace, so you are not buying this document from us, but from seller elinesteur. Stuvia facilitates payment to the seller.
Will I be stuck with a subscription?
No, you only buy this summary for 2,99 €. You're not tied to anything after your purchase.