tableau desktop specialist exam with complete solu
tableau desktop specialist exam
tableau desktop specialist e
tableau desktop specialist
Escuela, estudio y materia
Tableau Desktop Specialist
Tableau Desktop Specialist
Vendedor
Seguir
Schoolflix
Comentarios recibidos
Vista previa del contenido
Tableau Desktop Specialist Exam With
Complete Solutions
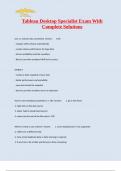
Live vs. extracts data connection Answer: LIVE
- changes will be shown automatically
- creates slower performance for huge data
- Server availability could be a problem
- Best to use when numbers HAVE to be correct
EXTRACT
- creates a static snapshot of your data
- better performance and portability
- save and refresh the snapshot
- best to use when numbers aren't as important
How to save metadata properties in a .TDS Answer: 1. go to the sheet
2. right click on the data source
3. select 'Add to Saved Data Sources'
4. make sure the end of the file ends in .TDS
When is it best to use a blend? Answer: 1. Cross-database join is not supported
2. Tables are at different LOD
3. Joins create duplicate data or data cleaning is required
4. If you have a lot of data and the join is time consuming
,How do you rename a data field? Answer: Right click on the data field and select 'rename'
How to assign an alias to a data value? Answer: Right click a dimension and select 'Aliases". In the
edit aliases dialog box, under value, select a member and enter a new name
How to assign a geographic role to a data field? Answer: click the data type icon next to the field
and select 'geographic role'.
then select the geographic role you want to assign to that field
Change data type for a data field (number, date, string, boolean, etc) Answer: A. On the data source
page, click on the icon associated with the field and select the new data type
B. In the data pane, if you right click on the field and scroll down to 'change data type'
Change default properties for a data field (number format, aggregation, color, date, format, etc)
Answer: In the data pane, right click on the field, scroll down to 'default properties' and change the
desired value
How to create a visual group? Answer: Control click all of the fields you want created in the group.
Right click on these values and select the group button
How to create a group using labels? Answer: Right click on the field you would like to be grouped,
click on 'create' and then 'group'. Be sure to select 'include other'
How to create a set? Answer: for a static set, select all fields you want included in the set from the
view, right click and select 'create set'
, for a dynamic set, right click on the field you want to create a set for, scroll down to 'create' and select
'set'
How to add a context filter? Answer: They are executed before normal filters.
Right click on the field you want to be a context filter and click 'add to context'
(ex: find top 5 for each sub-category)
How to add a reference line or a trend line? Answer: You can only add a reference line to
continuous fields. A. Go to the Analytics pane and drag the reference line to the visualization
B. Right click the axis and select 'add reference line'
What is a table calculation and how do you create them? Answer: calculations that we made on the
output table. It is represented by a triangle in the pill.
If you right click on the field, and go to "quick table calculation", you can add a table calculation to the
view
How do you edit the bin size of a histogram? Answer: a bin is the bucket size of each histogram bar.
Right click the field you want to create a bin for, go to create and select 'bin'
You can either input a number or you can create a parameter to edit the bin size.
How do you create a calculated field (ex. string, date, simple arithmetic)? Answer: this is a new field
from our existing data.
Right click the blank area in the data pane and select "create calculated field". You can then select
functions to help you create your calculated field
Los beneficios de comprar resúmenes en Stuvia estan en línea:
Garantiza la calidad de los comentarios
Compradores de Stuvia evaluaron más de 700.000 resúmenes. Así estas seguro que compras los mejores documentos!
Compra fácil y rápido
Puedes pagar rápidamente y en una vez con iDeal, tarjeta de crédito o con tu crédito de Stuvia. Sin tener que hacerte miembro.
Enfócate en lo más importante
Tus compañeros escriben los resúmenes. Por eso tienes la seguridad que tienes un resumen actual y confiable.
Así llegas a la conclusión rapidamente!
Preguntas frecuentes
What do I get when I buy this document?
You get a PDF, available immediately after your purchase. The purchased document is accessible anytime, anywhere and indefinitely through your profile.
100% de satisfacción garantizada: ¿Cómo funciona?
Nuestra garantía de satisfacción le asegura que siempre encontrará un documento de estudio a tu medida. Tu rellenas un formulario y nuestro equipo de atención al cliente se encarga del resto.
Who am I buying this summary from?
Stuvia is a marketplace, so you are not buying this document from us, but from seller Schoolflix. Stuvia facilitates payment to the seller.
Will I be stuck with a subscription?
No, you only buy this summary for 14,20 €. You're not tied to anything after your purchase.