Lote
MATH 225N Full Week 3 Assignments, Discussions and Lab Assignments (Bundle)
MATH 225N Full Week 3 Assignments, Discussions and Lab Assignments (Bundle)
[Mostrar más]MATH 225N Full Week 3 Assignments, Discussions and Lab Assignments (Bundle)
[Mostrar más]
1. Question: Which of the following histograms shows a skewed data set? 2. Question: Given the following box-and-whisker plot, decide if the data is skewed or symmetrical. 3. Question: You are told that a data set has a median of 14and a mean of 14. Which of the following is a logical conclusion? ...
Vista previa 1 fuera de 6 páginas
Añadir al carrito1. Question: Which of the following histograms shows a skewed data set? 2. Question: Given the following box-and-whisker plot, decide if the data is skewed or symmetrical. 3. Question: You are told that a data set has a median of 14and a mean of 14. Which of the following is a logical conclusion? ...
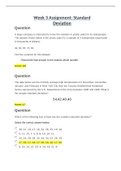
1. Question: Find the mode of the following number of times each machine in a car factory needed to be fixed within the last year. 2, 5, 6, 12, 14, 12, 6, 2, 5, 3, 14, 5 2. Question: Given the following list of data, find the median. 22, 33, 17, 8, 17, 29, 18, 13, 26, 28 3. Question: Find the me...
Vista previa 1 fuera de 4 páginas
Añadir al carrito1. Question: Find the mode of the following number of times each machine in a car factory needed to be fixed within the last year. 2, 5, 6, 12, 14, 12, 6, 2, 5, 3, 14, 5 2. Question: Given the following list of data, find the median. 22, 33, 17, 8, 17, 29, 18, 13, 26, 28 3. Question: Find the me...

1. Question: A data set lists the number of extra credit points awarded on midterm scores of 15 students taking a statistics course. For this data set, the minimum is 3, the median is 15, the third quartile is 16, the interquartile range is 4, and the maximum is 19. Construct a box-and-whisker plot...
Vista previa 1 fuera de 7 páginas
Añadir al carrito1. Question: A data set lists the number of extra credit points awarded on midterm scores of 15 students taking a statistics course. For this data set, the minimum is 3, the median is 15, the third quartile is 16, the interquartile range is 4, and the maximum is 19. Construct a box-and-whisker plot...
1. Question: A large company is interested to know the variation in yearly sales for its salespeople. The dataset shown below is the yearly sales for a sample of 5 salespeople (expressed in thousands of dollars): 40, 60, 65, 70, 80 Find the variance for this dataset. 2. Question: The data below a...
Vista previa 1 fuera de 6 páginas
Añadir al carrito1. Question: A large company is interested to know the variation in yearly sales for its salespeople. The dataset shown below is the yearly sales for a sample of 5 salespeople (expressed in thousands of dollars): 40, 60, 65, 70, 80 Find the variance for this dataset. 2. Question: The data below a...
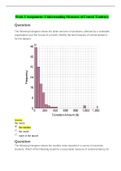
1. Question: The following histogram shows the dollar amounts of donations collected by acharitable organization over the course of a month. Identify the best measure of central tendency for this data set. 2. Question: The following histogram shows the monthly rents reported in a survey of universi...
Vista previa 1 fuera de 34 páginas
Añadir al carrito1. Question: The following histogram shows the dollar amounts of donations collected by acharitable organization over the course of a month. Identify the best measure of central tendency for this data set. 2. Question: The following histogram shows the monthly rents reported in a survey of universi...
Initial Post Instructions For this Discussion, you will examine central tendency and variability in terms of pulse rate. Find and record the pulse rate of 10 different people where you work. Tell us a little about the population from which you drew your data. Describe your findings in terms of cen...
Vista previa 1 fuera de 3 páginas
Añadir al carritoInitial Post Instructions For this Discussion, you will examine central tendency and variability in terms of pulse rate. Find and record the pulse rate of 10 different people where you work. Tell us a little about the population from which you drew your data. Describe your findings in terms of cen...
Initial Post Instructions For this Discussion, you will examine central tendency and variability in terms of pulse rate. Find and record the pulse rate of 10 different people where you work. Tell us a little about the population from which you drew your data. Describe your findings in terms of cen...
Vista previa 1 fuera de 2 páginas
Añadir al carritoInitial Post Instructions For this Discussion, you will examine central tendency and variability in terms of pulse rate. Find and record the pulse rate of 10 different people where you work. Tell us a little about the population from which you drew your data. Describe your findings in terms of cen...
Scenario/Summary This week's lab highlights the use of graphics, distributions, and tables to summarize and interpret data. Follow the directions below to find one of the given academic articles from the Chamberlain library and then use that to describe the graphs and tables included. Further, you...
Vista previa 1 fuera de 4 páginas
Añadir al carritoScenario/Summary This week's lab highlights the use of graphics, distributions, and tables to summarize and interpret data. Follow the directions below to find one of the given academic articles from the Chamberlain library and then use that to describe the graphs and tables included. Further, you...
Scenario/Summary This week's lab highlights the use of graphics, distributions, and tables to summarize and interpret data. Follow the directions below to find one of the given academic articles from the Chamberlain library and then use that to describe the graphs and tables included. Further, you...
Vista previa 1 fuera de 5 páginas
Añadir al carritoScenario/Summary This week's lab highlights the use of graphics, distributions, and tables to summarize and interpret data. Follow the directions below to find one of the given academic articles from the Chamberlain library and then use that to describe the graphs and tables included. Further, you...
Scenario/Summary This week's lab highlights the use of graphics, distributions, and tables to summarize and interpret data. Follow the directions below to find one of the given academic articles from the Chamberlain library and then use that to describe the graphs and tables included. Further, you ...
Vista previa 1 fuera de 3 páginas
Añadir al carritoScenario/Summary This week's lab highlights the use of graphics, distributions, and tables to summarize and interpret data. Follow the directions below to find one of the given academic articles from the Chamberlain library and then use that to describe the graphs and tables included. Further, you ...

Scenario/Summary This week's lab highlights the use of graphics, distributions, and tables to summarize and interpret data. Follow the directions below to find one of the given academic articles from the Chamberlain library and then use that to describe the graphs and tables included. Further, you...
Vista previa 1 fuera de 5 páginas
Añadir al carritoScenario/Summary This week's lab highlights the use of graphics, distributions, and tables to summarize and interpret data. Follow the directions below to find one of the given academic articles from the Chamberlain library and then use that to describe the graphs and tables included. Further, you...
Scenario/Summary This week's lab highlights the use of graphics, distributions, and tables to summarize and interpret data. Follow the directions below to find one of the given academic articles from the Chamberlain library and then use that to describe the graphs and tables included. Further, you...
Vista previa 2 fuera de 6 páginas
Añadir al carritoScenario/Summary This week's lab highlights the use of graphics, distributions, and tables to summarize and interpret data. Follow the directions below to find one of the given academic articles from the Chamberlain library and then use that to describe the graphs and tables included. Further, you...
Scenario/Summary This week's lab highlights the use of graphics, distributions, and tables to summarize and interpret data. Follow the directions below to find one of the given academic articles from the Chamberlain library and then use that to describe the graphs and tables included. Further, you...
Vista previa 2 fuera de 5 páginas
Añadir al carritoScenario/Summary This week's lab highlights the use of graphics, distributions, and tables to summarize and interpret data. Follow the directions below to find one of the given academic articles from the Chamberlain library and then use that to describe the graphs and tables included. Further, you...

Compradores de Stuvia evaluaron más de 700.000 resúmenes. Así estas seguro que compras los mejores documentos!

Puedes pagar rápidamente y en una vez con iDeal, tarjeta de crédito o con tu crédito de Stuvia. Sin tener que hacerte miembro.

Tus compañeros escriben los resúmenes. Por eso tienes la seguridad que tienes un resumen actual y confiable. Así llegas a la conclusión rapidamente!
You get a PDF, available immediately after your purchase. The purchased document is accessible anytime, anywhere and indefinitely through your profile.
Nuestra garantía de satisfacción le asegura que siempre encontrará un documento de estudio a tu medida. Tu rellenas un formulario y nuestro equipo de atención al cliente se encarga del resto.
Stuvia is a marketplace, so you are not buying this document from us, but from seller KnowledgeBase. Stuvia facilitates payment to the seller.
No, you only buy this summary for $99.48. You're not tied to anything after your purchase.
4.6 stars on Google & Trustpilot (+1000 reviews)
45,681 summaries were sold in the last 30 days
Founded in 2010, the go-to place to buy summaries for 14 years now