3.1 Multilevel and Longitudinal Data Analysis
… this is gone be a long one. But heey! Only 2 more to go
(just a little heads up after having written it.. This is by far the longest part (as it was in the
lectures). It literally makes approx. half of this whole summary. I tried my best to include as much
information as I could of what he said.. Good luck!!)
1. Data Structure
Hierarchical Data
● Hierarchical (multilevel/clustered) data structures are very common in Social and
Behavioural sciences
○ (explicit) multi-stage sampling: the sample is taken at multiple, hierarchically
ordered, levels
○ (implicit) schools belong to various types of groups "clusters" (children in schools;
employees in rms, etc)
○ It is normal and natural that people and data belong to certain groups, and it is
normal and natural that being in a group influences their members in a way. That
means that people within a group are more alike each other than a “random” person
outside that group
● Often there are variables that
○ Describe the individual's (lower level);
○ Describe the groups (higher level), also often called the clusters
● There are variables that describe either the lower level (for example the students (from
different schools)) and there are variables that describe the higher level (e.g., the school).
● Another example of a hierarchy is in longitudinal studies where individuals are followed
over time(longitudinal data)
Multiple measurements within individuals (notice that here the individual is level 1, so the
higher-level variable, aka the cluster, while they were level 2 (the lower level) in the
previous data. So, it depends on the context of your data to see whether the variable of
interest is at level 1 or 2)
○ there are variables that describe the occasions (lower level: time-varying, also
Level 2 variable)
1. Age or time point
2. Time-varying covariates: occupational status, happiness level
○ There are variables that describe the individual's (longitudinal)/schools (higher level
- clusters: constant over time, also Level 2 variable)
1. Gender
2. Treatment group
Repeated measures: all subjects measured at same time points
It is also possible that people are being measured at different times. In the multilevel model
you can deal with these “irregularities' '.
More complex examples ( not needed for the exam)
● Although we will mainly deal with two-level data, we often have more complex hierarchical
structures
Three-level or higher-level data:
○ Pupils in classes in schools
, 31
○ occasions in pupils in classes
○ Occasions in pupils in classes in schools
Cross-classified data
○ Children live in a certain neighbourhood and go to a particular school
What is a level? Units sampled at random from a population. Another argument is the
number of units. So, you need a certain number of parts (example numbers of schools) to
make it a level.
Terminology: hierarchical data, multilevel data, longitudinal data, repeated measures, …
Sometimes it can be rather difficult to then see which variable is at what level. Or even what a level
is among those variables.
2. ICC problem (problem of correlation)
The problem of correlation
● In normal analysis there is usually an assumption of independence, meaning that the score
on any scale is unrelated to any other score. When you look at clusters this is of course not
the case, as they are related to one another.
For example, children within one school might be/are related to one another, because they
have the same teachers or class environment.
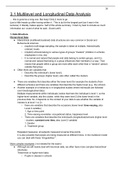
● To visualize:
Here we look at all data points without regarding
any correlations and connection between the
people/points.
Here the estimates for this data might be
intercept: 22.14, and the slope -.15.
(example grade per hour studying.. Would now
mean less studying → worst grades)
If we now take the higher level (colours) into
account, then we can see that those data points
are actually more related to each other. So, you
can also see, that it would be a positive
relationship of (e.g.) studying more ends in a
better grade. So, it can quite change the
relationship. Solution: use multilevel analysis.
Problem: the basic assumption of linear regression is violated: residuals are correlated as
residuals (within clusters) are not independent.
, 32
Solution:
● We encounter differences ("variance") at two levels
○ within "clusters": differences/ variance at lower-level variation in scores between
children from the same family
○ Between “clusters": systematic differences/ variance at higher level variation in
average math score between families
○ Total variance is a combination of within and between variances
When is there a large amount of "correlation" among residuals/ data points within a family?
○ Small differences in *e.g.) math score within a family (within "clusters")/ between
children from the same family
○ Large (systematic) differences between families (between “clusters")
○ So, within a family (or cluster) they are all very similar, but the difference between
families is very large. So, it is the ratio between those two
Intra-class correlation
● For data with a two-level hierarchical structure, the intra-class correlation is the ratio of the
between-cluster variance to the total-variance
○ Large systematic between-cluster variance (relative to within-cluster variance) gives
a large intra-class correlation
○ Small systematic between-cluster variance
(relative to within-cluster variance)gives small
intra-class correlation
● observations that are close together in space/time(i.e.,
individuals in the same cluster observations from the
same person) are likely to be more similar to each other
than observations far apart in space/time (i.e., individuals
from different clusters or observations from different
persons)
● sharing the same context (i.e., group/ person) is likely to cause dependency among
observations
3. Multilevel Modelling
● Linear regression ignores hierarchical structure of the data
○ Assumes no intra-class correlation: systematic between-cluster variance becomes
part of error variance (linear regression uses total variance as error variance)
○ incorrect standard errors and p-values(depend on error variance)for regression
coefficients (intercept, slope)
○ violation of the independence of residuals assumption
So the assumption is that there is variance between people, but not between
families. As in being in one family does not influence your score in a similar way to
other members of your family.
● Multilevel modelling
○ Distinction between- and within- cluster variance ("composite residual")
(only the within-cluster variance is error. The between is the actual effect)
○ correct standard errors and p-values for regression coefficients ("fixed effects”)
, 33
Three main reasons for using multi-level models
● Statistical reason: correct inference (p-values)
○ using correct standard errors (and p-values) for test for significance of regression
coefficients
○ small effect on estimate of regression coefficients
● Substantive reason: ask richer questions
○ within-person differences ("pattern of change") and effects of within-person (time-
varying) covariates
○ Differences between persons in change pattern and how these differences can be
explained by person covariates
○ relation between person specific starting point and rate of change
(we can look for patterns within/between groups and differences of people form
these patterns. Investigate which factors cause these pattern changes. Or see how
a starting point influences the rate of change)
● practical reason: can handle various types of data (also missing data)
So how does it work?
Multilevel models
● Based on regression models but more flexible (so some things quite similar, but also add:)
● Using random effects to capture correlation/ association in the data modelling the
covariance structure of the data (correlated data)
● Explicitly model the various levels in the data
● Very flexible with missing data
● Different terms for the same thing: individual growth models, random coefficient(regression)
models, multilevel models, mixed models, hierarchical (linear) models, growth curve models
Multilevel modelling vs Repeater Measures ANOVA
Analysing longitudinal data with repeated measures (m) anova has several limitations
(basically, it only works if the data is really balanced, so the same number of measurements for
each individual, and also measured at the same time.)
● only captures a specific type of dependence between observations (sphericity/ compound
found symmetry)
(sphericity assumption basically means that the dependency is as strong for each pair of
measurements that I am looking at. So, the dependence between different time point is the
same. (So, time points 1 to 2 are as dependent on each other as 2 to 3. So, this might quite
likely be violated. So → multilevel model).
○ (If the sphericity assumption holds, then) rm-anova equivalent to random intercepts
(not slopes!) model (see later)
● Cannot handle unbalanced data
○ balanced design: everyone needs to be measured at the same discrete set of time
points
○ relationship of the response variable may not be with the discrete time points but
with the age of the participants at the discrete time points
● cannot handle missing data: subjects with missing data are removed from analysis
● Cannot handle non-normally distributed (non-continuous and bounded) data
○ dichotomous (depressed/ not depressed): multilevel logistic model
○ Likert Scale (7-point scale)
○ sum of a set of item scores (implying a minimum and maximum score)
Los beneficios de comprar resúmenes en Stuvia estan en línea:
Garantiza la calidad de los comentarios
Compradores de Stuvia evaluaron más de 700.000 resúmenes. Así estas seguro que compras los mejores documentos!
Compra fácil y rápido
Puedes pagar rápidamente y en una vez con iDeal, tarjeta de crédito o con tu crédito de Stuvia. Sin tener que hacerte miembro.
Enfócate en lo más importante
Tus compañeros escriben los resúmenes. Por eso tienes la seguridad que tienes un resumen actual y confiable.
Así llegas a la conclusión rapidamente!
Preguntas frecuentes
What do I get when I buy this document?
You get a PDF, available immediately after your purchase. The purchased document is accessible anytime, anywhere and indefinitely through your profile.
100% de satisfacción garantizada: ¿Cómo funciona?
Nuestra garantía de satisfacción le asegura que siempre encontrará un documento de estudio a tu medida. Tu rellenas un formulario y nuestro equipo de atención al cliente se encarga del resto.
Who am I buying this summary from?
Stuvia is a marketplace, so you are not buying this document from us, but from seller fionabrosig. Stuvia facilitates payment to the seller.
Will I be stuck with a subscription?
No, you only buy this summary for $9.77. You're not tied to anything after your purchase.