1BM110 – Data-driven AI
Summary of Lectures
Written by:
R.F.J.F. Van Doorslaer, 1001804
April 9th, 2023
, Lecture 1 – Data Visualization & Preprocessing
Data Visualization
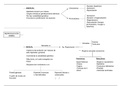
This concept falls under the data understanding block in the CRISP-DM Framework.
Figure 1: CRISP-DM Framework.
It is important for understanding your data (trends, patterns, anomalies, outliers) and for illustrating the results
of your predictions (comparing and evaluating models). There are three types of data we can visualize:
categorial data, numerical data and relationships.
Categorical Data
A pie chart is an illustration of the relative amounts for a particular variable.
Figure 2: Pie chart
A bar chart is an illustration of amounts for one or more variables.
Figure 3: Bar chart
2
,A mosaic plot shows mosaic tiles, which are proportional to variable combinations in the data. It needs at least
two variables. The horizontal lines indicate the proportions for the first variable, while the vertical lines do so
for the other variable(s).
Figure 4: Mosaic Plot
Numerical Data
A bar chart is an illustration of the amounts for one or more variables. There are several variations for
numerical data: normal, clustered, and stacked.
Figure 5: Bar Chart
A line plot illustrates the data points and connects them with lines. Don’t use too many data points on the x-
axis, a scatter plot is better for this. Don’t have different y measurement for the same value of x.
3
, Figure 6: Line Plot
A scatter plot illustrates all points for the combination of variables. It allows for plotting a trend / regression
line.
Figure 7: Scatter Plot
Non-numerical data
Text can be visualized in a tag cloud.
Figure 8: Tag Cloud
4
Summary of Lectures
Written by:
R.F.J.F. Van Doorslaer, 1001804
April 9th, 2023
, Lecture 1 – Data Visualization & Preprocessing
Data Visualization
This concept falls under the data understanding block in the CRISP-DM Framework.
Figure 1: CRISP-DM Framework.
It is important for understanding your data (trends, patterns, anomalies, outliers) and for illustrating the results
of your predictions (comparing and evaluating models). There are three types of data we can visualize:
categorial data, numerical data and relationships.
Categorical Data
A pie chart is an illustration of the relative amounts for a particular variable.
Figure 2: Pie chart
A bar chart is an illustration of amounts for one or more variables.
Figure 3: Bar chart
2
,A mosaic plot shows mosaic tiles, which are proportional to variable combinations in the data. It needs at least
two variables. The horizontal lines indicate the proportions for the first variable, while the vertical lines do so
for the other variable(s).
Figure 4: Mosaic Plot
Numerical Data
A bar chart is an illustration of the amounts for one or more variables. There are several variations for
numerical data: normal, clustered, and stacked.
Figure 5: Bar Chart
A line plot illustrates the data points and connects them with lines. Don’t use too many data points on the x-
axis, a scatter plot is better for this. Don’t have different y measurement for the same value of x.
3
, Figure 6: Line Plot
A scatter plot illustrates all points for the combination of variables. It allows for plotting a trend / regression
line.
Figure 7: Scatter Plot
Non-numerical data
Text can be visualized in a tag cloud.
Figure 8: Tag Cloud
4