Detailed summary Management Research Methods 1 (Premaster Business Administration) -> summary of all lectures and sheets, including important images, graphs and examples.
[Mostrar más]
Última actualización de este documento: 4 año hace
Exam Guide for Applied Multivariate Data Analysis – Get yourself a Wonderful Grade!
Summary of Statistics (IBC), Radboud University
Answers assignment 3 business research methods
Todos para este libro de texto (117)
Escuela, estudio y materia
Universiteit van Amsterdam (UvA)
Business Administration
Management Research Methods 1 (6012S0044Y)
Todos documentos para esta materia (4)
2
reseñas
Por: sarah_van_vulpen • 3 año hace
Por: bo1911 • 4 año hace
Vendedor
Seguir
Daphne014
Comentarios recibidos
Vista previa del contenido
Summary Management Research Methods 1
Week 1
Data has fixed structure (otherwise computer is not able to handle data) -> data consists of a number
of properties (variables -> each column represents one variable) that are measured from a set of
things, people et cetera (units -> each row represents one unit). Data consists of two levels of
measurement:
Categorical: entities are divided into distinct categories:
o Binary variable: two outcomes (dead or alive).
o Nominal variable: values without difference or order (omnivore, vegetarian or vegan).
o Ordinal variable: values with difference (sort of scale -> bad, intermediate, good).
Numerical:
o Discrete data: data that counts (number of defects).
o Continuous: entities get a distinct score (temperature, body length).
Binary measurement doesn’t have a lot of information (size L -> doesn’t give a lot of information about
your size). Continuous measurement gives more information. Variables can be converted to a lower
level of measurement (body length < 160 cm is small and body length > 160 cm is tall) -> loss of
information (it’s not reversible, because the exact amount of cm’s cannot be retrieved).
The lower the amount of information in your data, the larger your sample needs to be to get a good
idea of what a variable does (numerical data contain more information than categorical data -> larger
samples for data needed with less information (binary data -> more than 300 observations, ordinal
data -> between 30 and 300 observations, numerical data -> 30 observations).
Three questions by quantitative research:
1. Is the sample representative?
Representativeness: statistics only give conclusions about the population you have sampled from
(measure revenue for 3 weeks in October -> conclusions not valid for July, ask 1000 people what they
will vote -> not representative for election results). Two questions to ask: what is the population? And
how to make my sample representative for that population? The sample needs to be a good
representation of the group -> you need to distribute your sample. Usually random sampling: assign
number to all units in the population -> let a computer draw randomly 30 number -> include
observations in your sample.
2. Is the data valid?
Validity: data reflect what they should reflect and can be used to answer the research question. Data
should be checked for errors and mistakes (face validity check), everybody should know the
measurement procedure when multiple people are involved in measurement and it should be looked
whether there were other problems or irregularities during measurement. Outlier: a score very different
from the rest of the data (deviating data) that is unlikely to happen (3 hours sleep and high exam score
-> not unlikely to happen -> no outlier) -> you have to check this.
3. Is there measurement error?
Measurement error: the discrepancy between the actual value we are trying to measure and the
number we use to represent that value (you weight 80 kilograms, but according to the bathroom scale,
you weigh 83 kilogram -> measurement error is 3 kilogram). You measure the same thing, but get
different results (even same person can get different results if he or she measures something two
times -> measure length of a people). Two types of measurement error:
Systematic: difference between average measurement result and true value (non-digital
bathroom scales can be calibrated, mobile phones are synchronised with online time servers).
Random: unsystematic deviations due to imprecision of the measurement system (multiple
time measurement systems are used for ice skating, two people who measure your length).
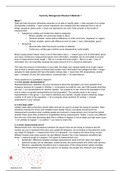
,Bias: tendency of a measurement process to over- or
underestimate value (biggest deviation from average)
(systematic measurement error). Example of two devices (true
value of 5.0):
Device 1 measures: 3.8, 4.4, 4.2, 4.0.
Device 2 measures: 6.5, 4.0, 3.2, 6.3.
Device 1 largest bias.
Describing data consists of giving a summary (no recite of the entire dataset) -> components:
Location:
o Median: middle score when data is ordered (2, 4, 5, 6, 8 -> median is 5) (salary of the
average employer).
o Mean: sum of data divided by amount of data (average) (2, 4, 5, 6, 8 -> = mean
is 5) (average salary of an employer).
Dispersion:
o Range: smallest value subtracted from largest (lowest is 2, highest is 8 -> range is 6).
So, range is very sensitive to outliers.
o Interquartile range: range of the middle 50% of the data (lower quartile until upper
quartile -> picking median and then median of lower half and upper half).
o Variance: average squared distance between each point and the mean of the data ->
2 ∑( xi − x́)2 . Example is measuring heights of people (see
s=
N −1
2
picture) -> ∑ (xi − x́) = 50 -> s2 = 50 / (3 – 1) = = 25.
o Standard deviation: square root of the variance -> sd=s=√ S2 . Preference for
standard deviation over variance. There are different degrees of dispersion:
High degree of dispersion -> large standard deviation.
Low degree of dispersion -> small standard deviation.
Other properties:
o Confidence interval: when we estimate something (mean, standard deviation), we
make sampling error (different sample will contain different estimates) -> X́ ≠ μ(will be
s s
close to each other -> in 95% of cases X́ −2 ≤ μ ≤ X́ +2 . More observations
√N √N
-> narrow error. Less observations -> bigger error,
o Skew: asymmetry of the distribution ->
Positive skew: scores bunched at low values with tail pointing to high values
(right skewed) -> average will be higher than median. (30, 40, 50, 50, 1000 ->
positive skew).
Negative skew: scores bunched at high values with tail pointing to low values
(left skewed) (life expectancy) -> average will be lower than median.
o Mode: most frequent score.
o Bimodal: having two modes.
, o Multimodal: having several modes -> population have to be split into homogenous
parts.
Plotting data used to display entire dataset. Best way to display depends on number of variables to
display (1 or 2) and kind of data (categorical or numerical) -> ways to plot:
Bar chart: used to display categorical data with vertical or horizontal bars.
Pie chart: used to display categorical data with pie pieces.
Histogram: used to display numerical data with bars.
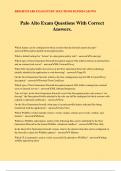
Boxplot: used to display numerical data with quartiles (box is first
quartile to third quartile). Can also be used to display a numerical
and categorical data variable. Parts of boxplot:
o Maximum: high values.
o Third quartile: 75% of the data lies below this value.
o Median.
o First quartile: 25% of the data lies below this value.
o Minimum: low values.
In boxplots you can have dots (potential outliers) and stars (outliers
for sure).
Multiple bars: used to display two categorical variables with bars.
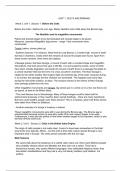
Scatterplot: used to display two numerical variables with points at a
chart. Independent variable -> horizontal axis. Dependent variable ->
vertical axis. Scatterplot with line -> line is regression (correlation)
and dots are the potential outliers.
You can see skewness in boxplot:
Median is in upper part of boxplot -> it’s negative skewed.
Median in bottom part of boxplot -> it’s positive skewed.
Week 2
Notion Practical (statistics) Theoretical
Variable Observed value Random variable
Mean x́ μ
Standard deviation s σ
Correlation r ρ
Belongs to Sample Population
The probability of a random variable assign probability to specific values. Probability is assigned to
events: things that can happen (heads, tails -> A depends on what you want to calculate) -> probability
of event: P[A] (two possible events when you flip coin -> head or tail -> probability of 1/2 -> P[A] = 1/2).
Three different types of probability:
Univariate categorical probability: probability of only one random non-numerical variable
(univariate: observations on only a single characteristic or attribute).
Bivariate categorical probability: relating variables to each other (what is the chance that you
pass the exam if you attend all the lectures -> two variables: exam and lectures).
Los beneficios de comprar resúmenes en Stuvia estan en línea:
Garantiza la calidad de los comentarios
Compradores de Stuvia evaluaron más de 700.000 resúmenes. Así estas seguro que compras los mejores documentos!
Compra fácil y rápido
Puedes pagar rápidamente y en una vez con iDeal, tarjeta de crédito o con tu crédito de Stuvia. Sin tener que hacerte miembro.
Enfócate en lo más importante
Tus compañeros escriben los resúmenes. Por eso tienes la seguridad que tienes un resumen actual y confiable.
Así llegas a la conclusión rapidamente!
Preguntas frecuentes
What do I get when I buy this document?
You get a PDF, available immediately after your purchase. The purchased document is accessible anytime, anywhere and indefinitely through your profile.
100% de satisfacción garantizada: ¿Cómo funciona?
Nuestra garantía de satisfacción le asegura que siempre encontrará un documento de estudio a tu medida. Tu rellenas un formulario y nuestro equipo de atención al cliente se encarga del resto.
Who am I buying this summary from?
Stuvia is a marketplace, so you are not buying this document from us, but from seller Daphne014. Stuvia facilitates payment to the seller.
Will I be stuck with a subscription?
No, you only buy this summary for $4.99. You're not tied to anything after your purchase.