MAC3702
Assignment 2 Semester 2 2024
Detailed Solutions, References & Explanations
Unique number:
Due Date: 12 September 2024
QUESTION 1
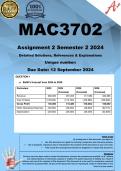
a. Bafifi’s forecast from 2024 to 2026
Particulars 2023 2024 2025 2026
(Forecast) (Forecast) (Forecast)
Revenue 260,000 291,200 311,584 333,385
Cost of Sales (125,000) (174,720) (160,980) (166,692)
Gross Profit 135,000 116,480 150,604) 166,692
Other Operating Expenses (40,000) (46,000) (48,300) (50,715)
Depreciation (23,000) (23,000) (23,000) (23,000)
Terms of use
By making use of this document you agree to:
• Use this document as a guide for learning, comparison and reference purpose,
• Not to duplicate, reproduce and/or misrepresent the contents of this document as your own work,
• Fully accept the consequences should you plagiarise or misuse this document.
Disclaimer
Extreme care has been used to create this document, however the contents are provided “as is” without
any representations or warranties, express or implied. The author assumes no liability as a result of
reliance and use of the contents of this document. This document is to be used for comparison, research
and reference purposes ONLY. No part of this document may be reproduced, resold or transmitted in any
form or by any means.
, +27 67 171 1739
QUESTION 1
a. Bafifi’s forecast from 2024 to 2026
Particulars 2023 2024 2025 2026
(Forecast) (Forecast) (Forecast)
Revenue 260,000 291,200 311,584 333,385
Cost of Sales (125,000) (174,720) (160,980) (166,692)
Gross Profit 135,000 116,480 150,604) 166,692
Other Operating Expenses (40,000) (46,000) (48,300) (50,715)
Depreciation (23,000) (23,000) (23,000) (23,000)
Profit from Operations 72,000 47,480 79,304 92,977
Finance Costs (24,000) (10,000) (10,000) 0
Profit before Tax 48,000 37,480 69,304) 92,977
Taxation (27%) (12,960) (10,120) (18,712) (25,104)
Profit after Tax 35,040 27,360 50,592 67,873
Calculations
Particulars 2023 2024 (Forecast) 2025 (Forecast) 2026 (Forecast)
Revenue 260,000 (260,000 ×1.12) (291,200 ×1.07) (311,584 ×1.07)
Cost of Sales (125,000) (116,480 ÷ 0.4) (174,720 ×0.92) (160,980 × 1.035)
Gross Profit 135,000 (291,200 × 0.4) (311,584 × (333,385 × 0.5)
0.4832)
Other Operating Expenses (40,000) (40,000 × 1.15) (46,000 × 1.05) (48,300 × 1.05)
Depreciation (23,000) (23,000) (23,000) (23,000)
Profit from Operations 72,000 (116,480 - 46,000 - (150,604 - 48,300 (166,692 - 50,715 -
23,000) - 23,000) 23,000)
Finance Costs (24,000) (100,000 × 10%) (10,000) 0
Profit before Tax 48,000 (47,480 - 10,000) (79,304 - 10,000) 92,977
Taxation (27%) (12,960) (37,480 × 27%) (69,304 × 27%) (92,977 × 27%)
Profit after Tax 35,040 (37,480 - 10,120) (69,304 - 18,712) (92,977 - 25,104)
Disclaimer
Extreme care has been used to create this document, however the contents are provided “as is” without
any representations or warranties, express or implied. The author assumes no liability as a result of
reliance and use of the contents of this document. This document is to be used for comparison, research
and reference purposes ONLY. No part of this document may be reproduced, resold or transmitted in any
form or by any means.


